 English
  Русский
 Bahasa Indonesia
 Bahasa Malay
 ไทย
ไทย Español
 Deutsch
 Български
 Français
 Tiếng Việt
 中文
中文 বাংলা
বাংলা हिन्दी
 Čeština
 Українська
 Română

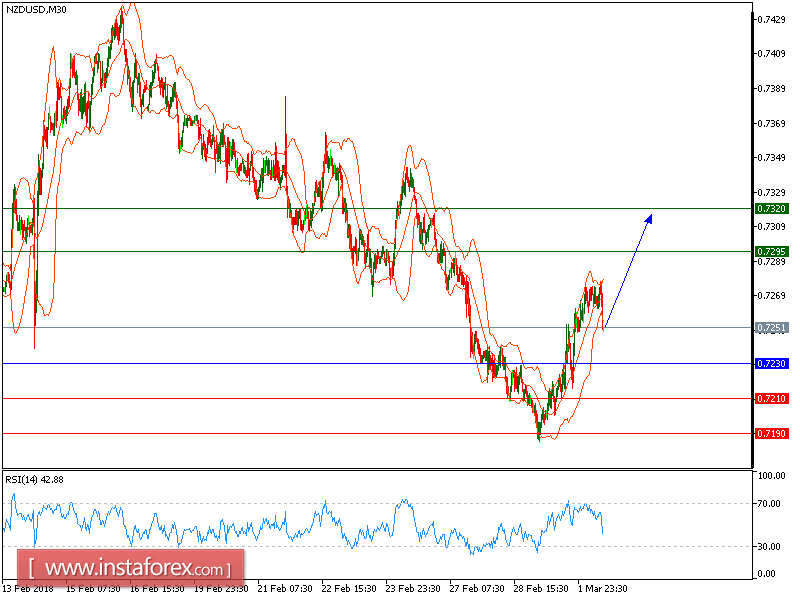
Our downside targets which we predicted in our previous analysis have been hit. The price rebounded from the exact second target which we predicted and now expected to trade upside. The pair remains supported by its rising trend line and is now challenging its key resistance at 0.7270. The 20-period moving average has reversed up and has also crossed above the 50-period one. In addition, the relative strength index is bullish above its neutrality area at 50.
To conclude, as long as 0.7230 is not broken, likely advance to 0.7295 and 0.7320 in extension.
The black line shows the pivot point. Currently, the price is above the pivot point which is a signal for long positions. If it remains below the pivot point, it will indicate short positions. The red lines show the support levels, while the green line indicates the resistance levels. These levels can be used to enter and exit trades.
Resistance levels: 0.7295, 0.7320, and 0.73650.
Support levels: 0.7210, 0.7190, and 0.7150.