English
  Русский
 Bahasa Indonesia
 Bahasa Malay
 ไทย
ไทย Español
 Deutsch
 Български
 Français
 Tiếng Việt
 中文
中文 বাংলা
বাংলা हिन्दी
 Čeština
 Українська
 Română

The beginning of the month is a continuation of sell-off on the stock exchanges. Their beneficiary, however, is not the US Dollar, but Japanese Yen. The reason is the yesterday's appearance of Trump, in which he announced the introduction of high tariffs on aluminum and steel. Such postulates, of course, raise legitimate concerns about the intensification of protectionist and commercial wars. USD/JPY goes down at 106.00, EUR/USD defended the key support zones around 1.2165 and 1.22 and is growing above 1.2260. The New Zealand Dollar is quite strong, with 0.25% strengthening today.
On Friday 2nd of March, the event calendar is busy with important data releases, so the global investors should keep an eye on German Retail Sales data, Spanish Unemployment Rate data, Italian Gross Domestic Product data, UK'S PMI Construction data, Canadian Gross Domestic Product data and Revised UoM Consumer Sentiment data from the US. There is a speech from Bank of England Governor Mark Carney scheduled at 12:00 am GMT today as well.
USD/JPY analysis for 02/03/2018:
President Trump met with steel and aluminum industry leaders and previewed plans to formally announce a 25% tariff on imported steel and a 10% tariff on aluminum. European equities had fallen sharply while US losses were only mild until the president's declaration on tariffs, then losses sharply accelerated, with industrial stocks weakest. Hope that the tariffs would not be announced after all saw bond yields and USD/JPY rally higher, but then they sharply reversed. 10yr US Treasury yields pushed up to 2.86% then slid to 2.81%, while 2yr yields fell from 2.26% to 2.21%. USD/JPY tested 107.20 then rolled over to below 106.40, but Canada is an obvious target of the tariffs, with its officials protesting Trump's announcement.
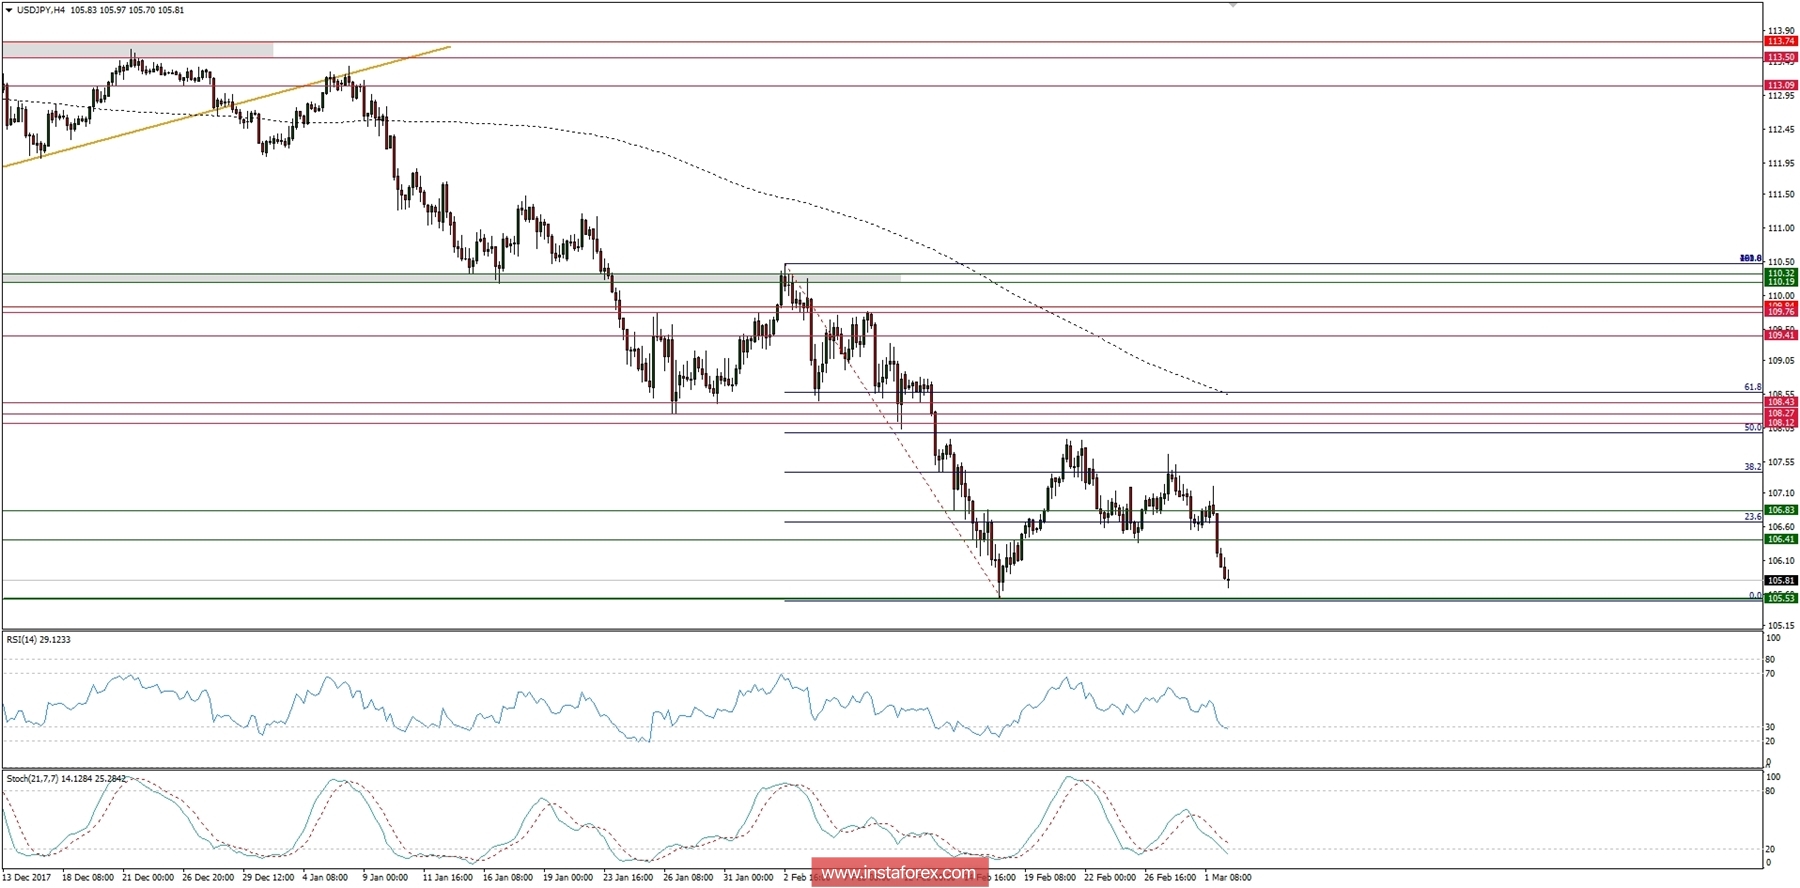
Let's now take a look at the USD/JPY technical picture at the H4 time frame. The market has failed to rally above the level of 107.20, quickly reversed and currently is getting ready to test the technical support at the level of 105.53. If this level is clearly violated, then the next support is seen at the level of 104.42 (weekly support). The momentum is still below its fifty level and it is pointing downward, so the bearish scenario is likely to occur soon. The nearest technical resistance is seen at the level of 106.41.