 English
  Русский
 Bahasa Indonesia
 Bahasa Malay
 ไทย
ไทย Español
 Deutsch
 Български
 Français
 Tiếng Việt
 中文
中文 বাংলা
বাংলা हिन्दी
 Čeština
 Українська
 Română

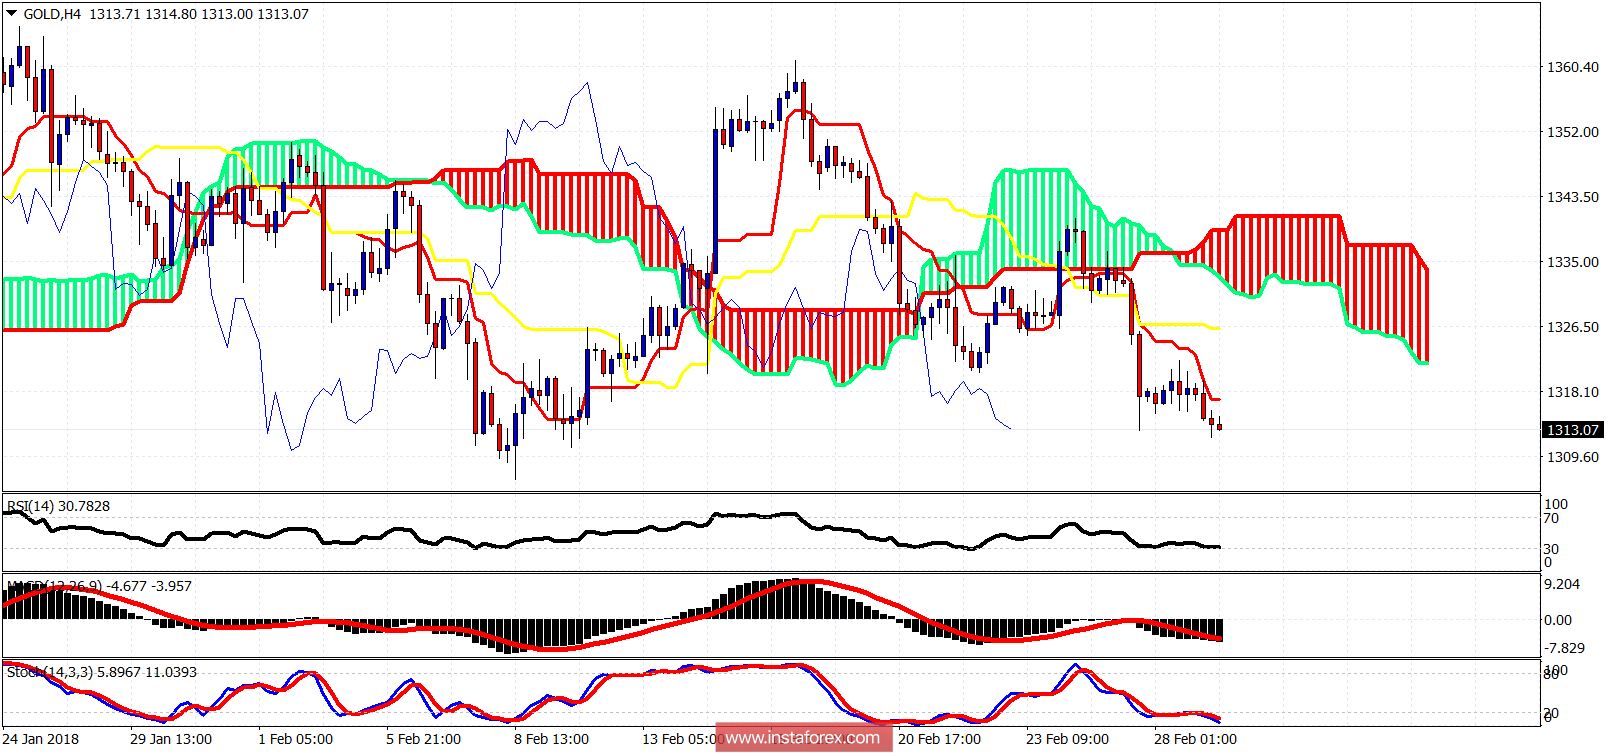
Gold price has made a new lower low. Price remains in a bearish short-term trend after the cloud rejection. Daily trend has turned to neutral after price entering the Daily Kumo.
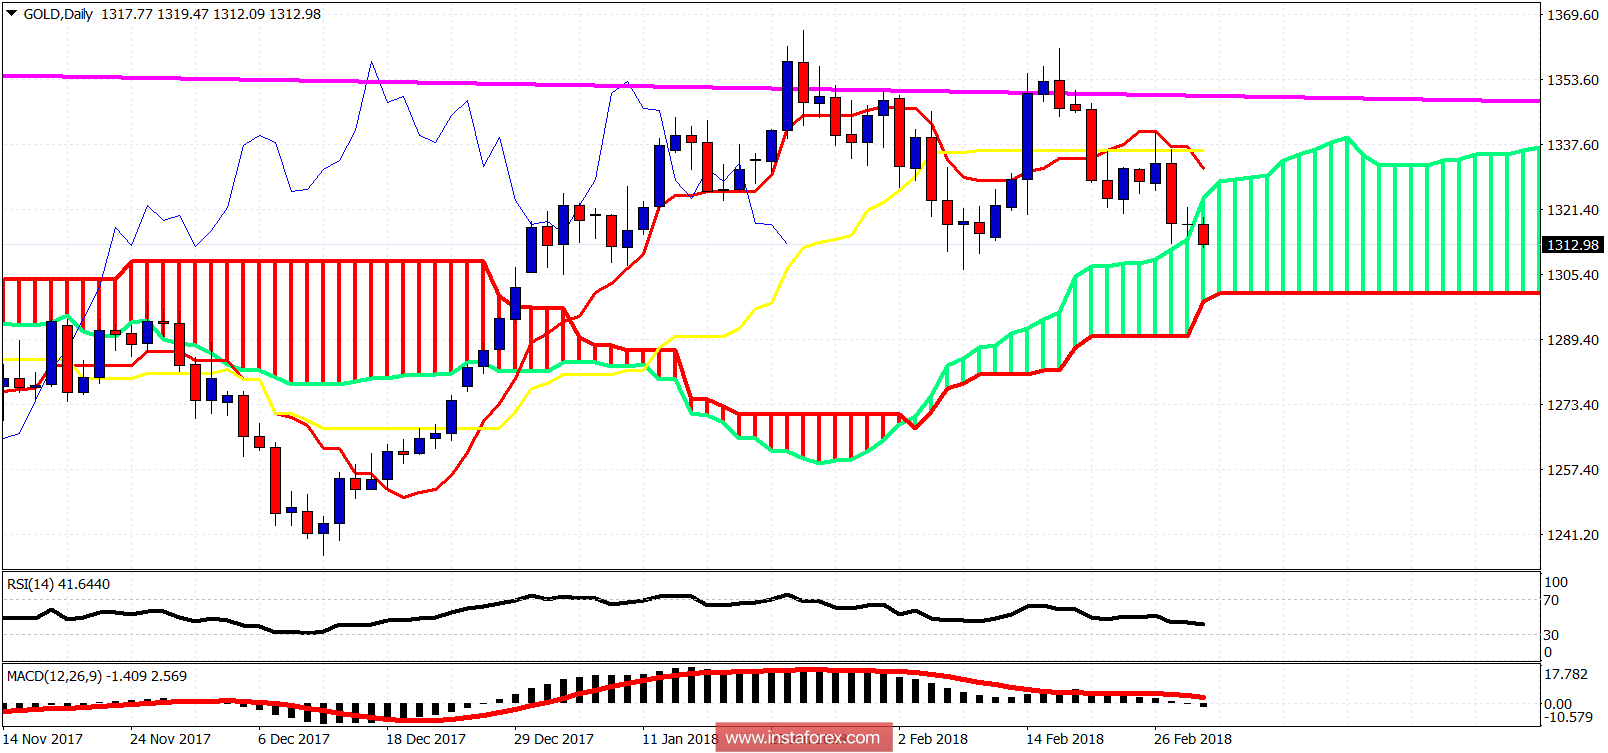
After the double top rejection at the long-term resistance and the rejection at the daily tenkan-sen early this week, Gold price has broken through the Kumo and is trading inside it. Daily trend has now turned to neutral. Support is at $1,300. If this level fails to hold we should expect Gold to move towards $1,285-70.