 English
  Русский
 Bahasa Indonesia
 Bahasa Malay
 ไทย
ไทย Español
 Deutsch
 Български
 Français
 Tiếng Việt
 中文
中文 বাংলা
বাংলা हिन्दी
 Čeština
 Українська
 Română

GBP/USD is on the way to reach new lows across the board, as the GBP is under pressure in the short-term. The nearest support lies at 1.3753, which is considered as a take profit zone. If the pair succeeds in break such area, it can plummet to test the psychological area of 1.3700. MACD indicator remains in the negative territory, calling for further downside.
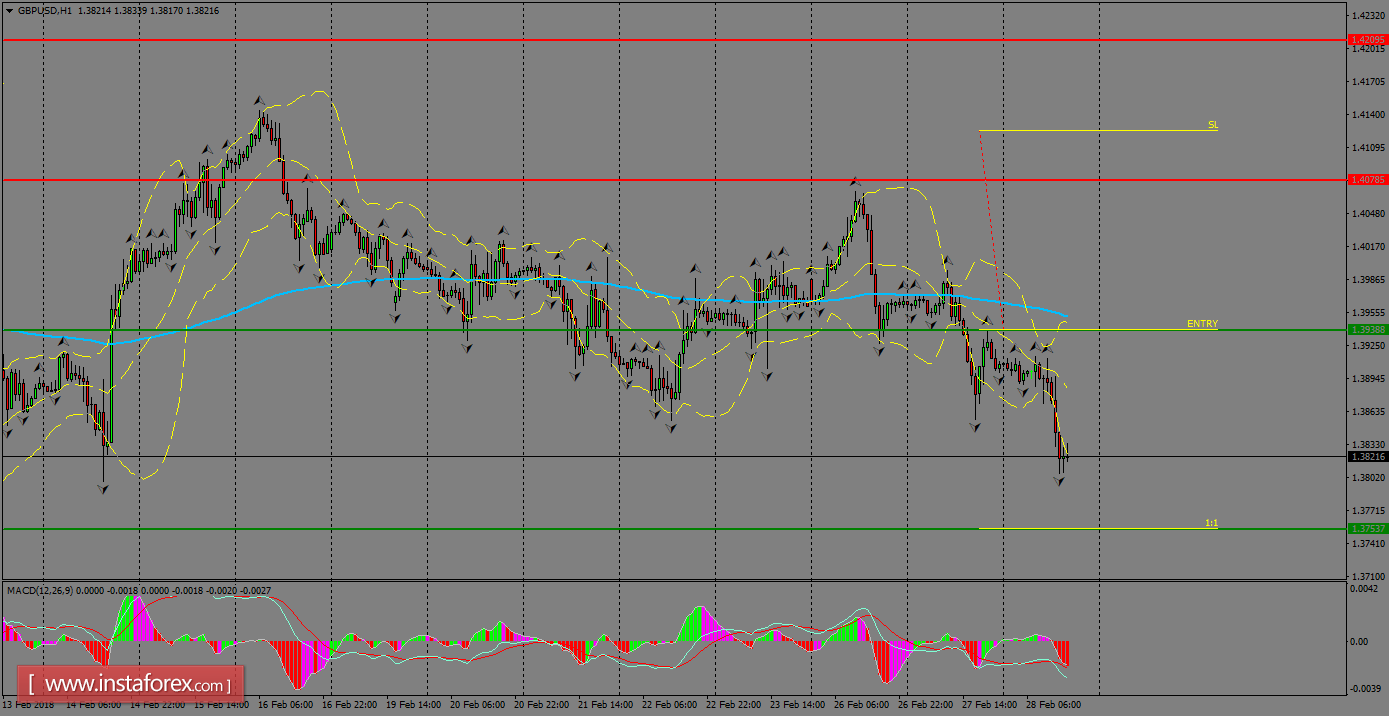
H1 chart's resistance levels: 1.4078 / 1.4209
H1 chart's support levels: 1.3939 / 1.3753
Trading recommendations for today: Based on the H1 chart, sell (short) orders only if the GBP/USD pair breaks a bearish candlestick; the resistance level is at 1.3939, take profit is at 1.3753 and stop loss is at 1.4130.