 English
  Русский
 Bahasa Indonesia
 Bahasa Malay
 ไทย
ไทย Español
 Deutsch
 Български
 Français
 Tiếng Việt
 中文
中文 বাংলা
বাংলা हिन्दी
 Čeština
 Українська
 Română

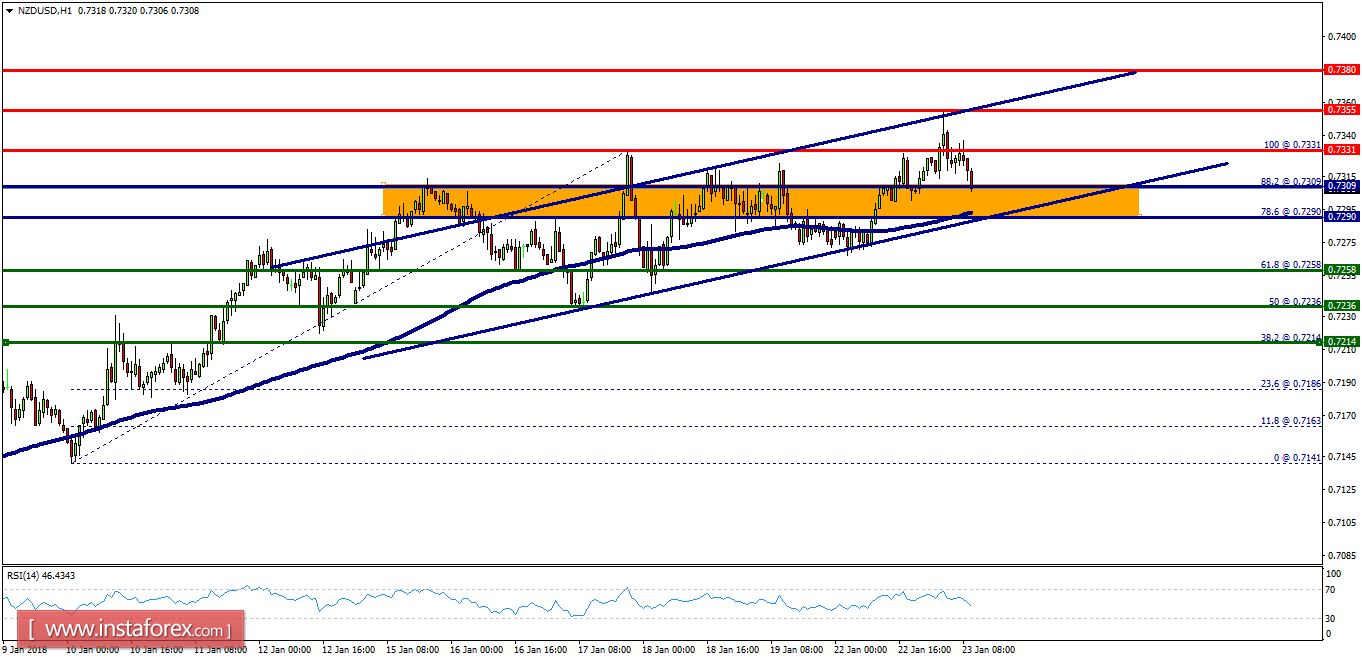
Overview :
- The NZD/USD pair continues to move upwards from the level of 0.7290 (78.6% of Fibonacci retracement levels). The pair rose from the level of 0.7290 to 0.7314. Today, resistance is seen at the levels of 0.7331 and 0.7355. However, the support levels are seen at 0.7290 and 0.7258. So, we expect the price to set above the strong support at the levels of0.7290 and 0.7258; because the price is in a bullish channel now. Amid the previous events, the price is still moving between the levels of 0.7290 and 0.7331. In overall, we still prefer the bullish scenario as long as the price is above the level of 0.7309. Furthermore, if the NZD/USD pair is able to break out the top at 0.7331, the market will rise further to 0.7355. On the other hand, if the price closes below the strong support of 0.7258, the best location for a stop loss order is seen below 0.7258; hence, the price will fall into a bearish trend in order to go further towards the strong support at 0.7236 to test it again. The level of 0.7236 will form a double bottom. Beriefly, the market is still calling for strong bullish market as long as the trensd is set above the price of 0.7236.