English
  Русский
 Bahasa Indonesia
 Bahasa Malay
 ไทย
ไทย Español
 Deutsch
 Български
 Français
 Tiếng Việt
 中文
中文 বাংলা
বাংলা हिन्दी
 Čeština
 Українська
 Română

Early Tuesday trading brings a calm trade on the forex market, which especially for USD means stopping the sell-off. Some timid corrections are seen for USD/JPY and NZD/USD, and the rest of the crosses are practically standing still. The stock market is climbing higher. Gold and Crude Oil are stable.
On Tuesday 16th of January, the event calendar is moderately busy, with data coming from Germany (Final Consumer Price Index), UK (Consumer Price Index) and the US ( Empire State Manufacturing Index). Later in the day, there is a scheduled speech from SNB Chairman Thomas Jordan.
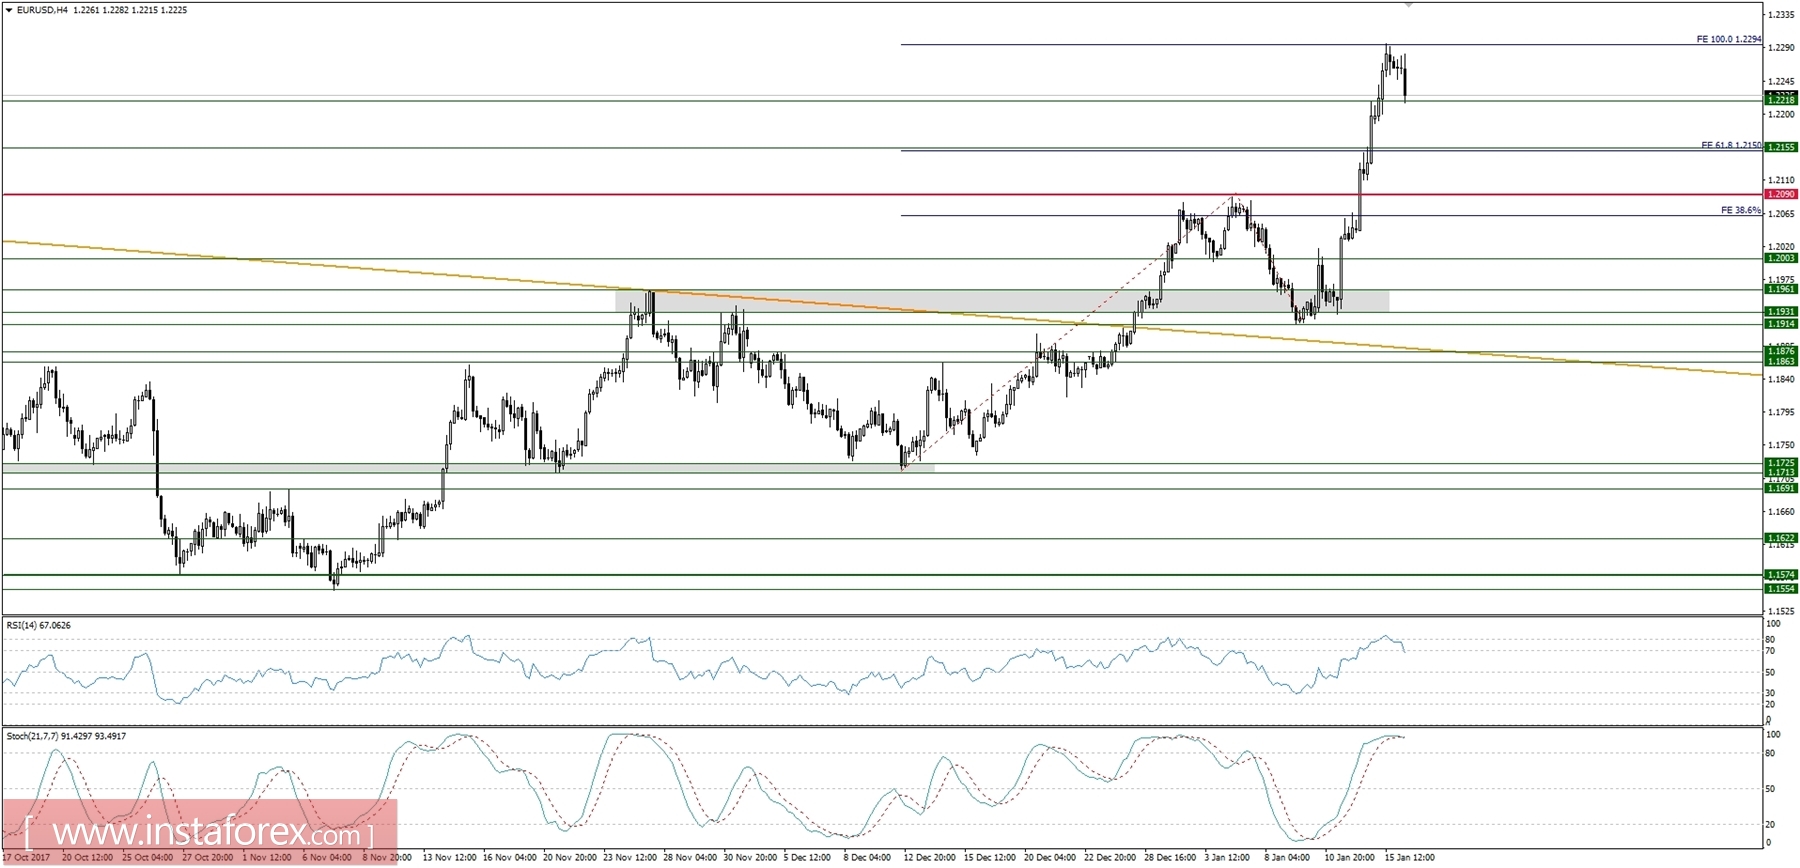
EUR/USD analysis for 16/01/2018:
On Monday evening the EUR received moderate support in the words of Hansson from the ECB. In an interview with the Boersen-Zeitung newspaper, he said that EUR appreciation is not yet a threat to inflation prospects, and if the economy develops in line with recent forecasts, it will be right to end asset purchases after September. It must be remembered, however, that Hansson is one of the more hawkish members of the ECB.
Let's now take a look at EUR/USD technical picture at the H4 time frame. The price reversed from 100% Fibo Extension at the level of 1.2294 and now is testing the support at the level of 1.2218. The market conditions are slightly overbought, so it is possible that the corrective cycle will test even lower areas of the recent rally, like the level of 1.2155 or even 1.2090. The larger time frame trend remains up.
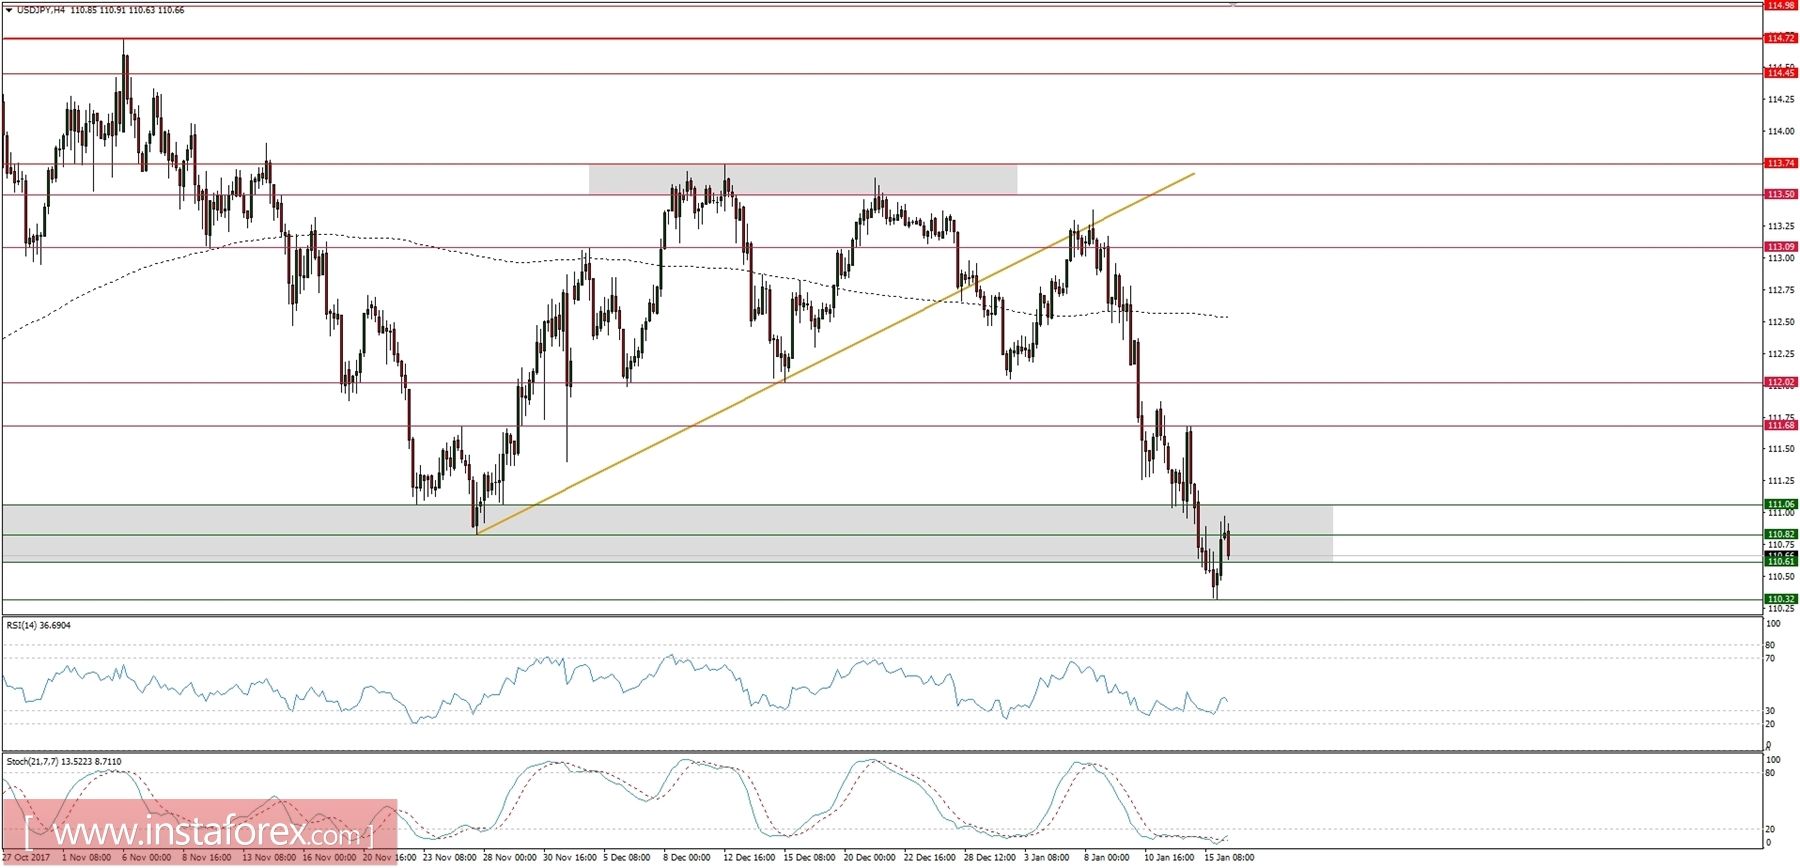
Market Snapshot: USD/JPY bounces a little
After the recent sell-off, the price of USD/JPY has broken below the important technical support zone between the levels of 110.61 - 111.06 and made a new low at the level of 110.32. Currently, the price is testing the zone from below and might even extend the corrective pullback towards the upper resistance level at 111.06.
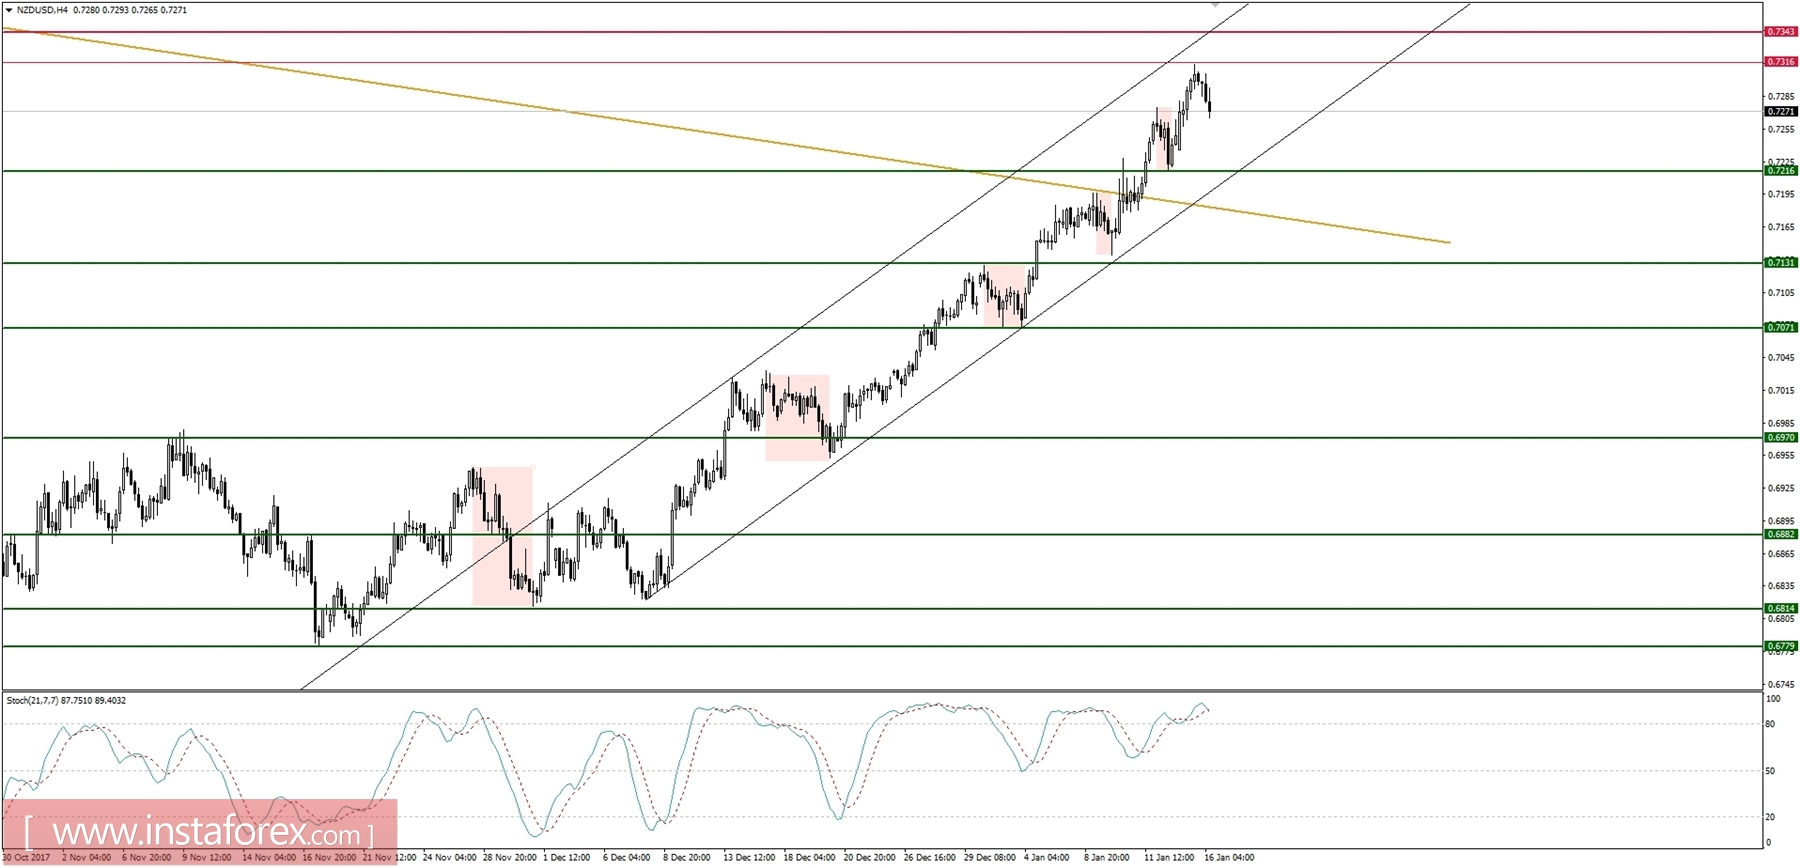
Market Snapshot: NZD/USD keeps rallying
The price of NZD/USD has been rallying since the end of 2017, broke above the long-term trend line around the level of 0.7200 and now is about to test the technical resistance at the level of 0.7343. The market conditions are extremely overbought, so the market might pull-back a little towards the next technical support at the level of 0.7216 before another leg up.