 English
  Русский
 Bahasa Indonesia
 Bahasa Malay
 ไทย
ไทย Español
 Deutsch
 Български
 Français
 Tiếng Việt
 中文
中文 বাংলা
বাংলা हिन्दी
 Čeština
 Українська
 Română

Daily Outlook
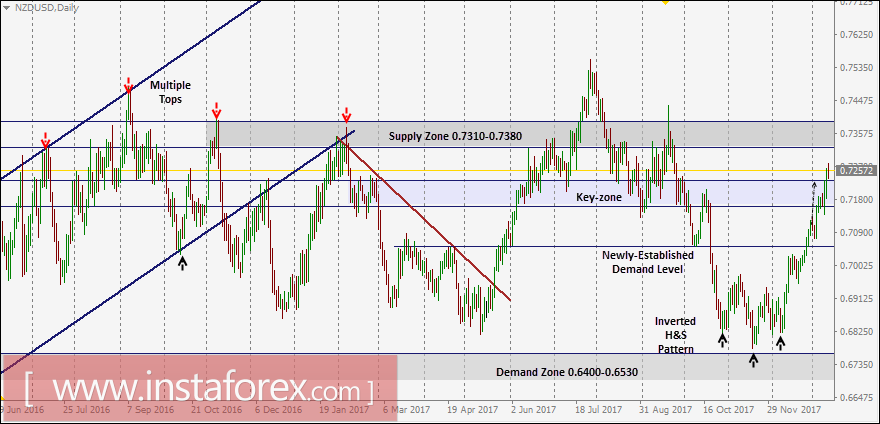
A recent bullish breakout above the downtrend line took place on May 22. Since then, the market has been bullish as depicted on the chart.
This resulted in a quick bullish advance towards next price zones around 0.7150-0.7230 (Key-Zone) and 0.7310-0.7380 which was temporarily breached to the upside.
Recent bearish pullback was executed towards the price zone of 0.7310-0.7380 (newly-established demand-zone) which failed to offer enough bullish support for the NZD/USD pair.
Re-consolidation below the price level of 0.7300 enhanced the bearish side of the market. This brought the NZD/USD pair again towards 0.7230-0.7150 (Key-Zone) which failed to pause the ongoing bearish momentum.
An atypical Head and Shoulders pattern was expressed on the depicted chart which initiated bearish reversal.
As expected, the price level of 0.7050 failed to offer enough bullish support for the NZD/USD pair. That's why, further bearish decline was expected towards 0.6800 (Reversal pattern bearish target).
Evident signs of bullish recovery was expressed around the recent low (0.6780). That's why, a bullish pullback was executed towards 0.7150-0.7240.
The current price zone of 0.7140-0.7250 was considered a prominent Supply-Zone to be watched for SELL positions if enough bearish rejection is expressed on a daily basis.
However, early signs of bullish breakout above 0.7250 are being manifested on the chart. If so, a quick bullish movement would be expected towards 0.7320-0.7390.