English
  Русский
 Bahasa Indonesia
 Bahasa Malay
 ไทย
ไทย Español
 Deutsch
 Български
 Français
 Tiếng Việt
 中文
中文 বাংলা
বাংলা हिन्दी
 Čeština
 Українська
 Română

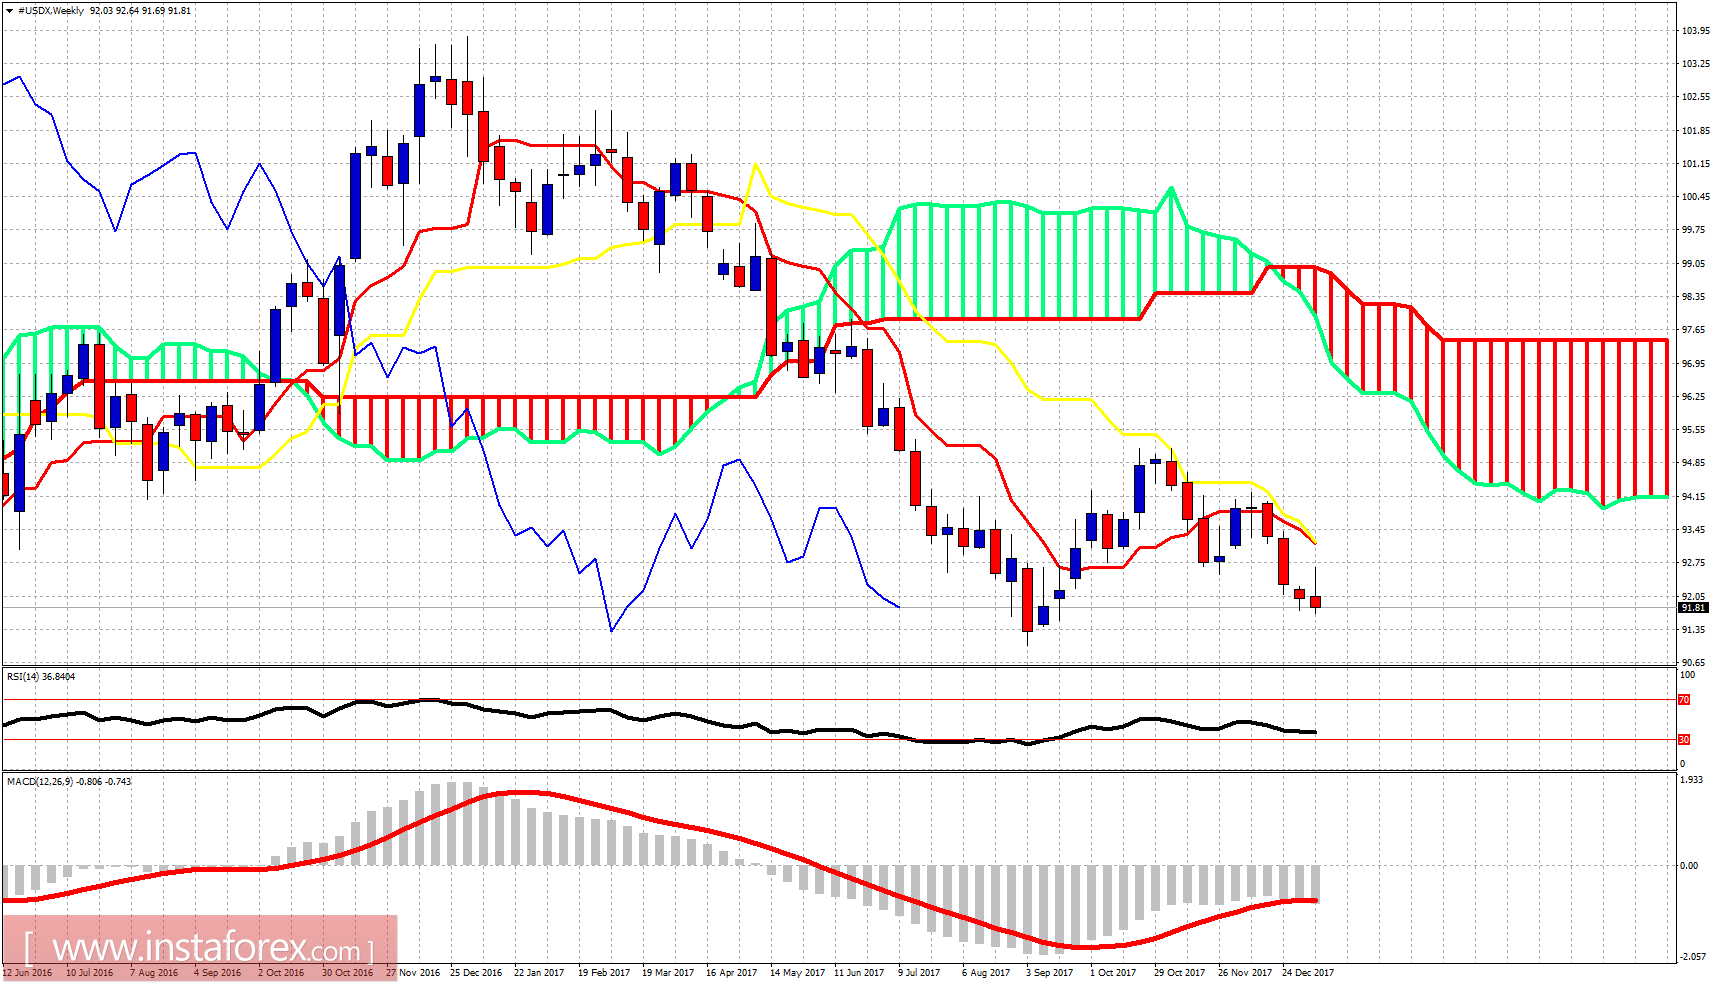
The Dollar index remains weak and in a bearish trend. Price is making new lows after we warned that a rejection at 92.60 would be a bearish sign for a move lower. There are some divergence signs in the current downward move so Dollar bears just need to be cautious. Breaking above 92.40 would be a bullish sign. Confirmation of a trend change will come on a break above 92.60.
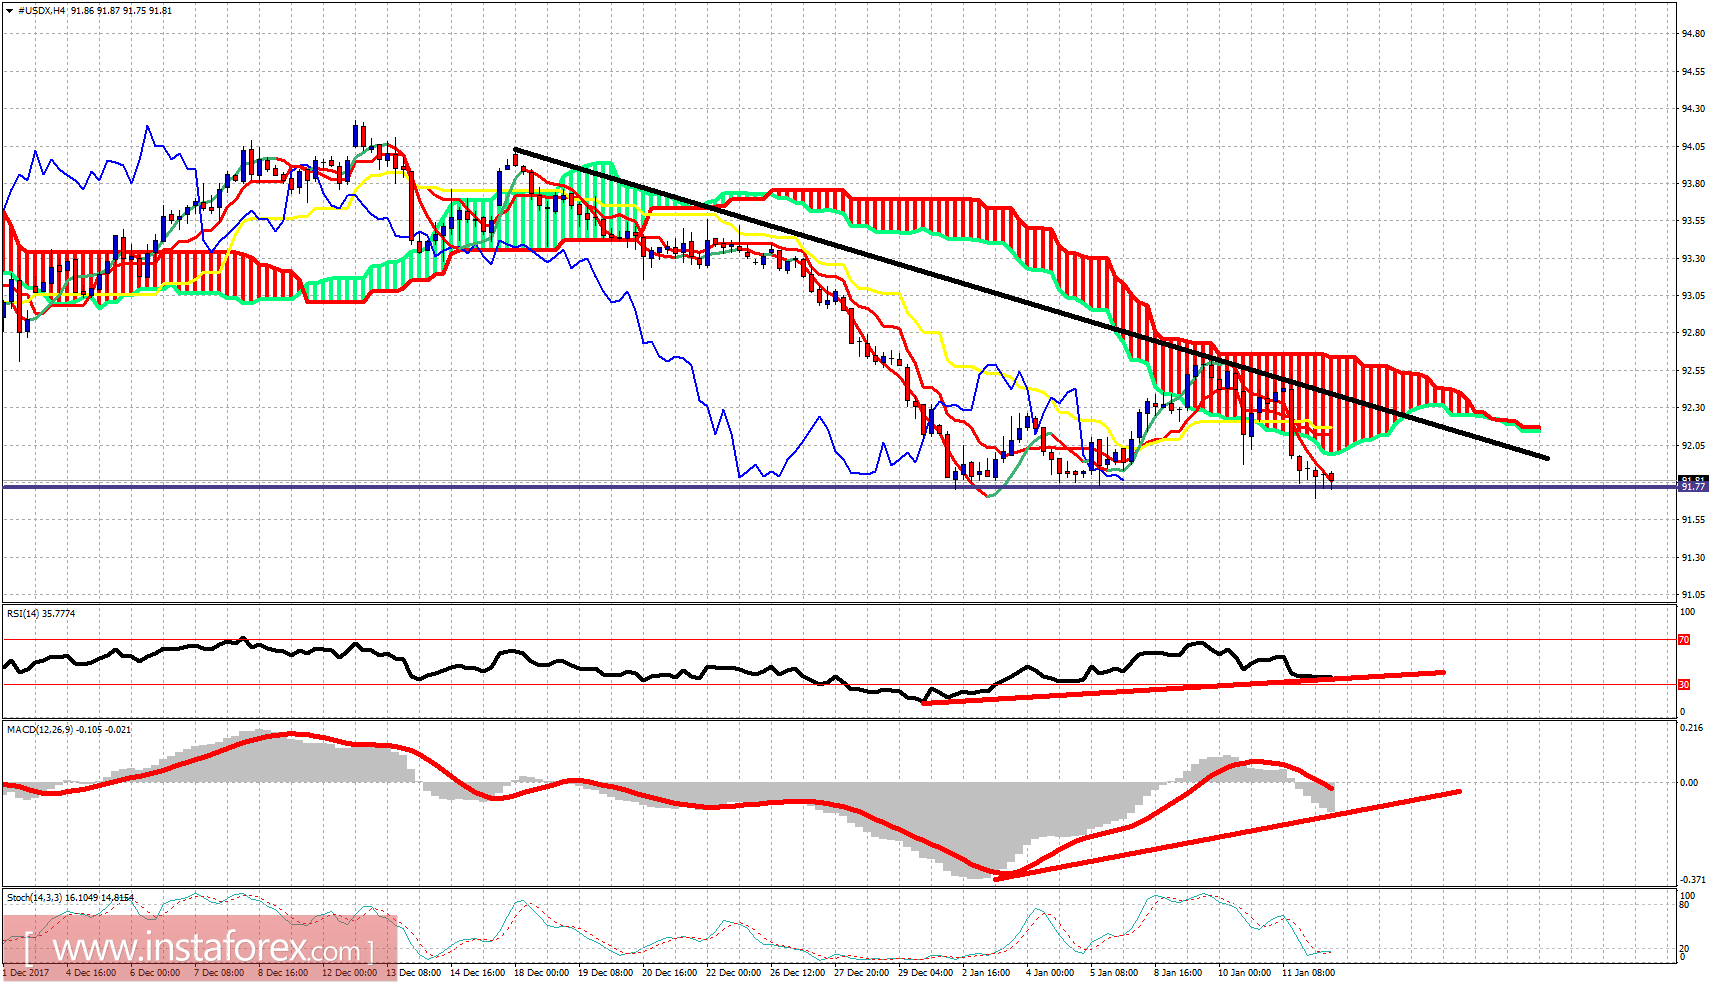
Red lines - bullish divergence signs
Short-term resistance is at 92.20. Any bounce towards that level could find sellers and get price rejected again. Breaking above 92.20 and specially 92.40 where the black trend line resistance is, would bring in more buyers. Both MACD and RSI are showing divergence signs in the 4 hour chart.