 English
  Русский
 Bahasa Indonesia
 Bahasa Malay
 ไทย
ไทย Español
 Deutsch
 Български
 Français
 Tiếng Việt
 中文
中文 বাংলা
বাংলা हिन्दी
 Čeština
 Українська
 Română

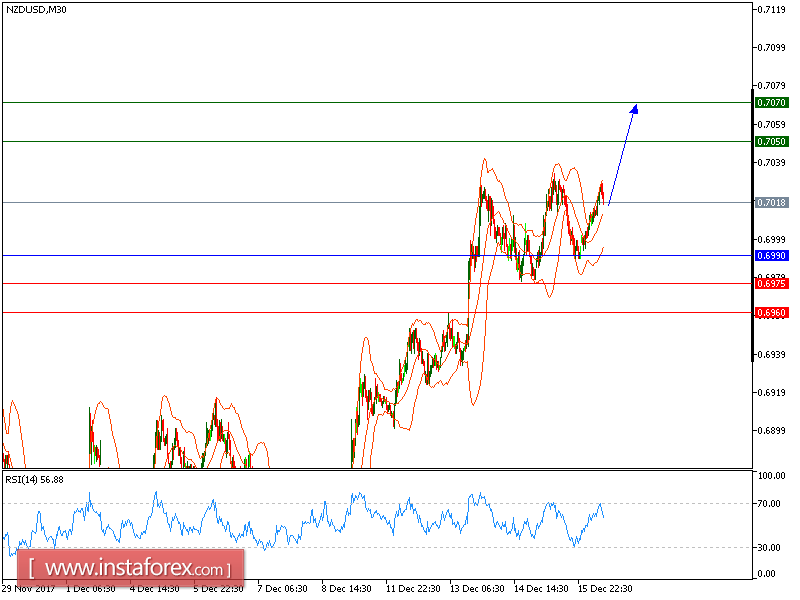
NZD/USD is expected to trade with a bullish outlook. The pair accelerated on the upside and broke above its key resistance at 0.6990, which becomes the key support now. The 20-period moving average crossed above the 50-one. The relative strength index is bullish and calls for a further rise.
To sum up, above 0.6990, look for a new challenge with targets at 0.7050 and 0.7070 in extension.
The black line shows the pivot point. Currently, the price is above the pivot point, which is a signal for long positions. If it remains below the pivot point, it will indicate short positions. The red lines are showing the support levels and the green line is indicating the resistance levels. These levels can be used to enter and exit trades.
Resistance levels: 0.7050, 0.7070, and 0.7105
Support levels: 0.6975, 0.6960, and 0.6920