English
  Русский
 Bahasa Indonesia
 Bahasa Malay
 ไทย
ไทย Español
 Deutsch
 Български
 Français
 Tiếng Việt
 中文
中文 বাংলা
বাংলা हिन्दी
 Čeština
 Українська
 Română

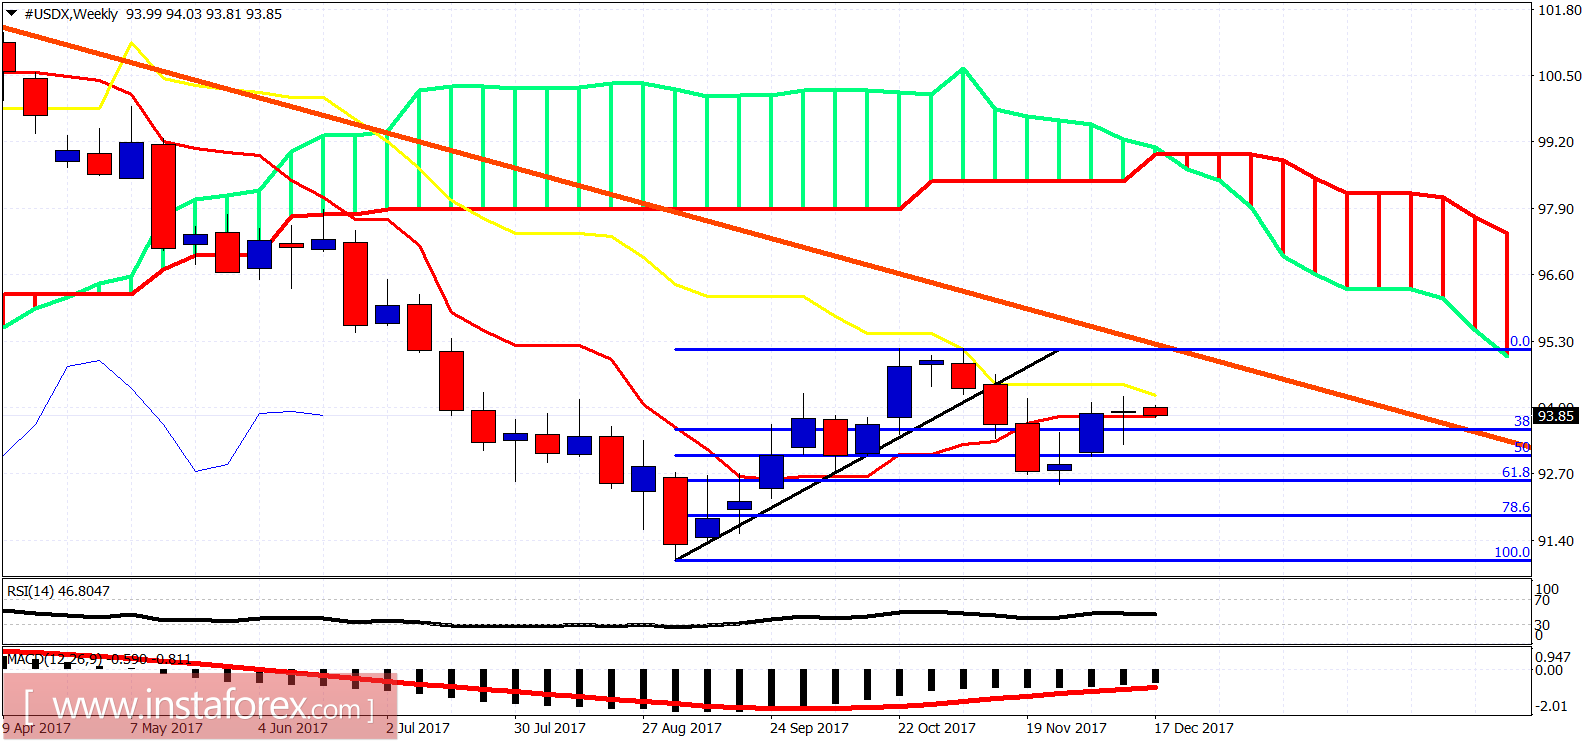
The Dollar index bounced strongly off the 50% Fibonacci retracement and the cloud support in the 4-hour chart as expected. The Dollar index reached 94 which is important short-term resistance and is showing rejection signs.
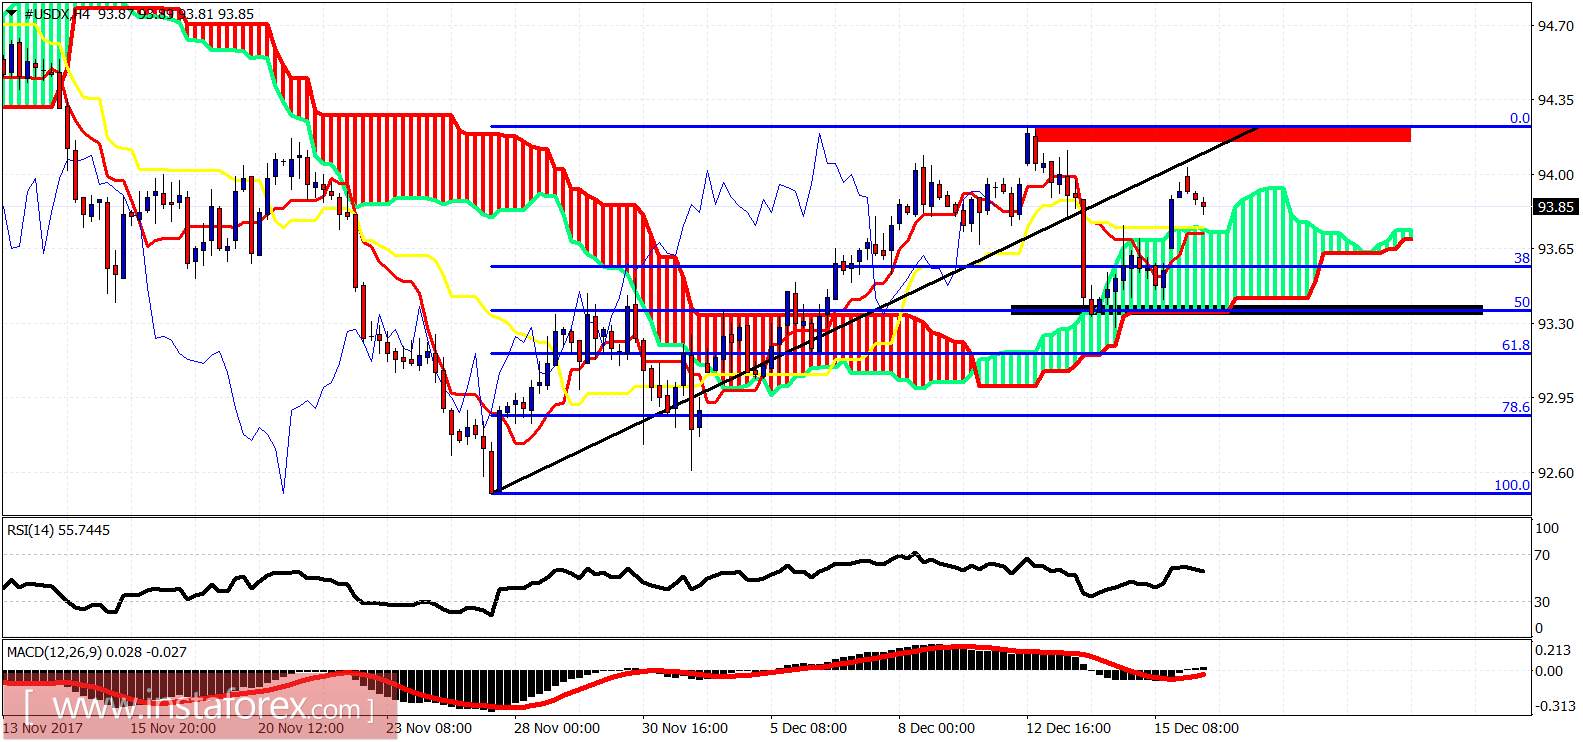
Black rectangle - support area
The Dollar index is at an important junction. A break above 94.05 will open the way for a move towards 96. A fall below 93.40 will push price towards 92.50 critical low. First important short-term support is at 93.30-93.40. Bulls do not want to see it broken.