English
  Русский
 Bahasa Indonesia
 Bahasa Malay
 ไทย
ไทย Español
 Deutsch
 Български
 Français
 Tiếng Việt
 中文
中文 বাংলা
বাংলা हिन्दी
 Čeština
 Українська
 Română

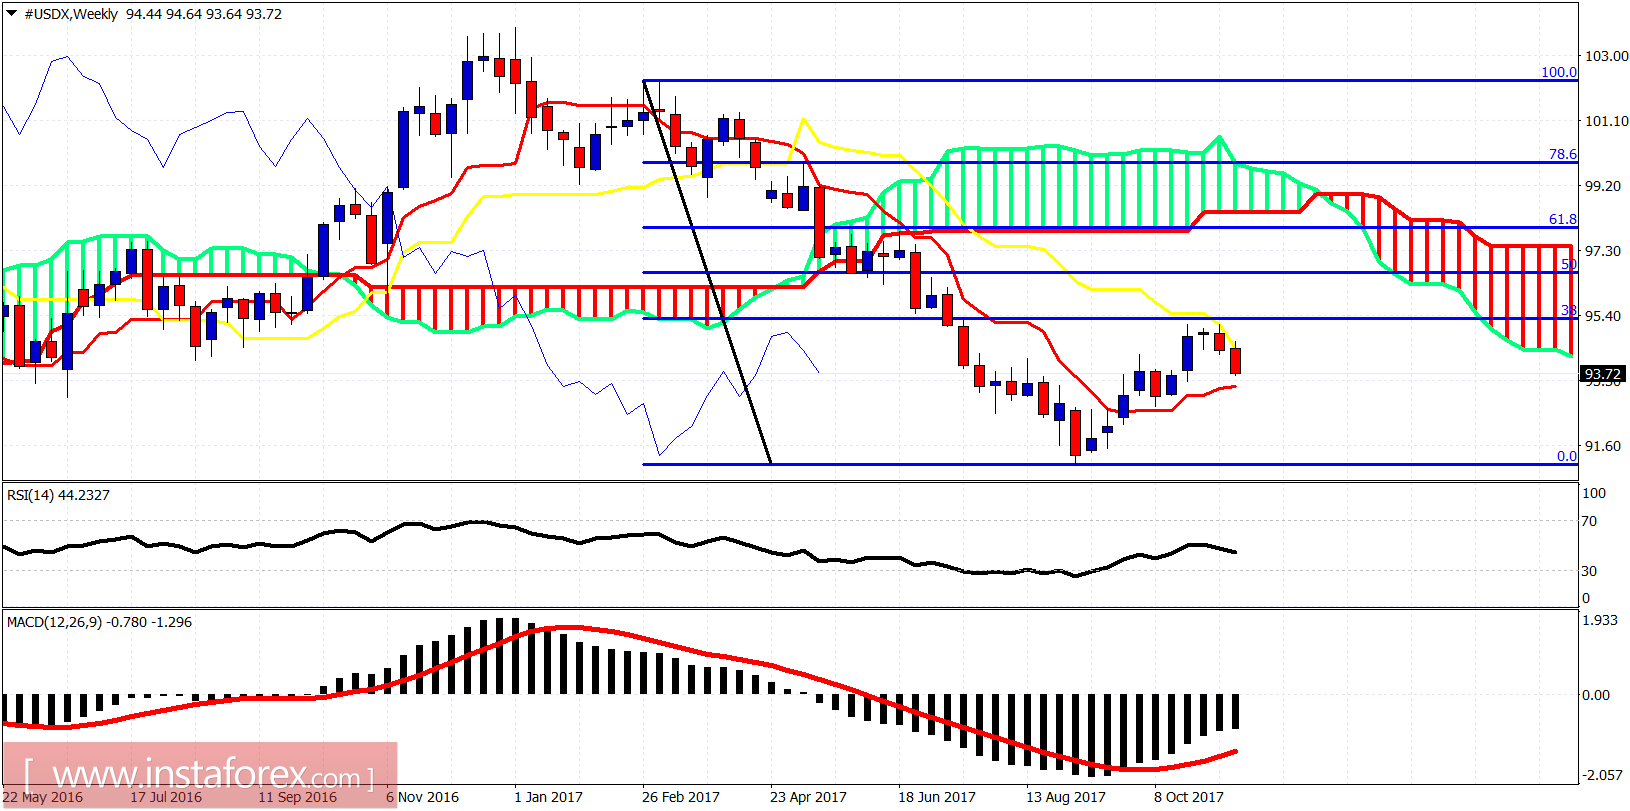
There are a lot of chances that the Dollar index has more upside if the current decline is wave A or wave 2. Today we are going to talk about this scenario and when it gets canceled. However our primary scenario remains the one where the entire upward corrective wave has been completed and we have already started the final leg down towards 88.
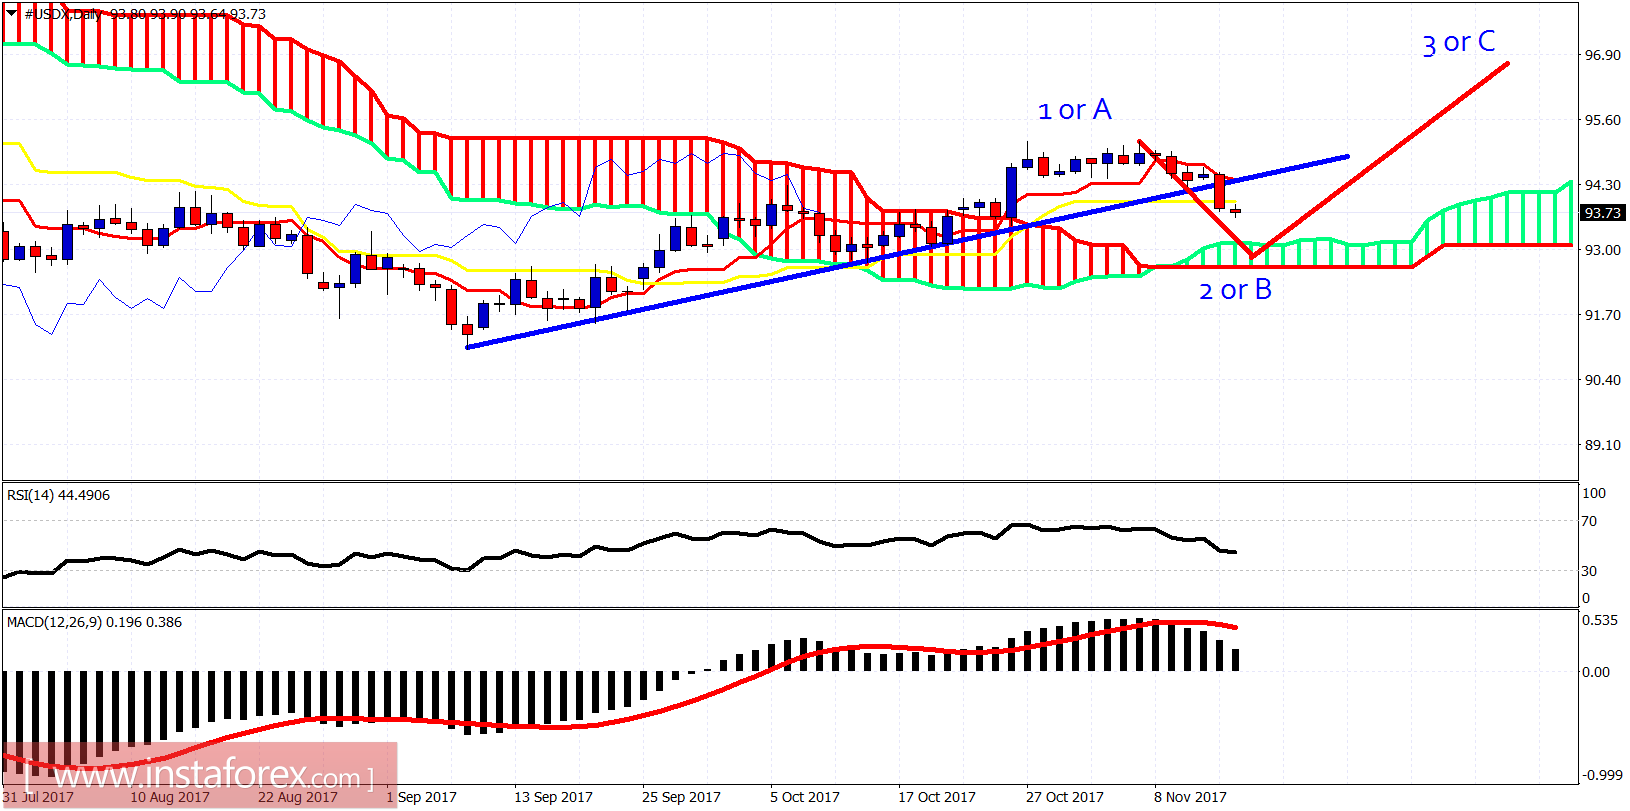
Red line - projection
The Dollar index has broken the trend line support and is heading towards cloud support at 93. This is also the area of the previous lesser degree fourth wave and high probability target for the pull back to end. Resistance is at 94.35. The downward move could very well be wave B or 2. A wave C or 3 should follow if this scenario is valid.