 English
  Русский
 Bahasa Indonesia
 Bahasa Malay
 ไทย
ไทย Español
 Deutsch
 Български
 Français
 Tiếng Việt
 中文
中文 বাংলা
বাংলা हिन्दी
 Čeština
 Українська
 Română

The index is extending the decline across the board and it looks like we can see further losses in coming days, as the greenback remains under pressure below the 200 SMA. The nearest support is located at 93.97 and one could expect a break below there in order to reach the 93.55 level. MACD indicator remains in favor of the bears.
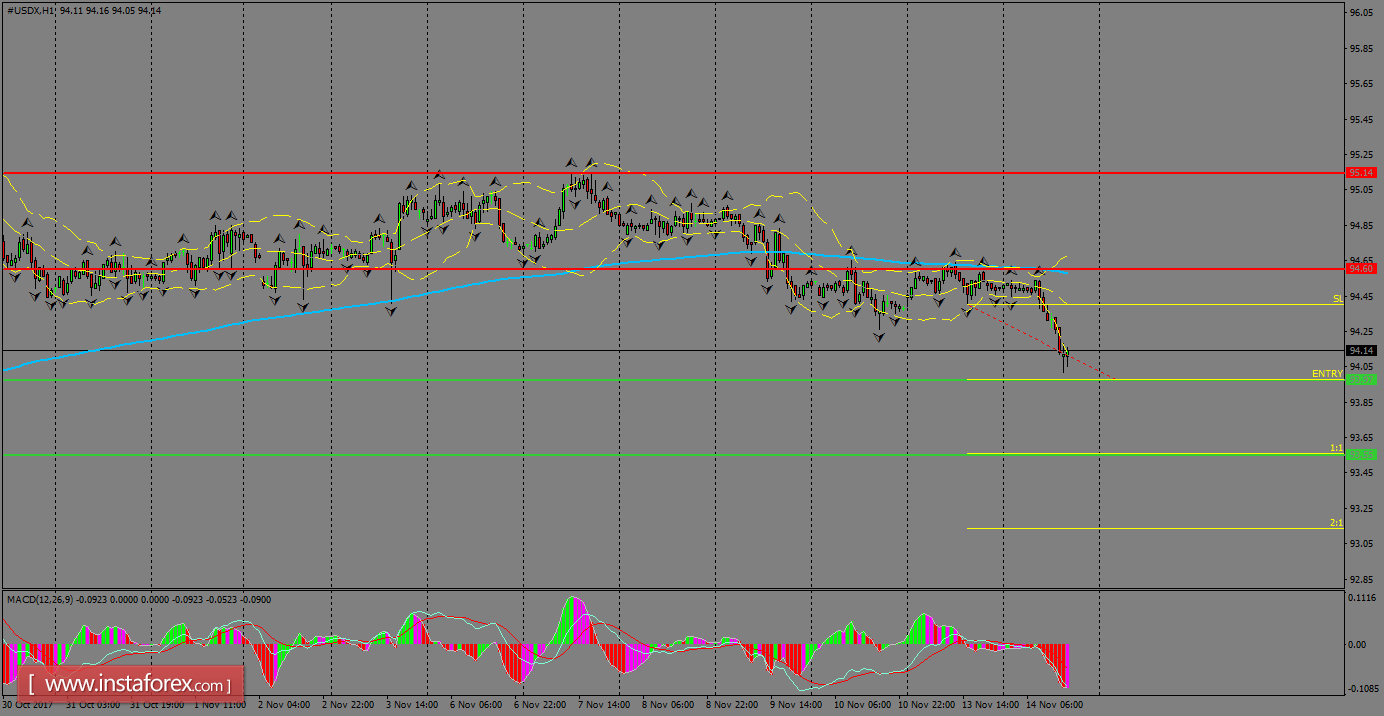
H1 chart's resistance levels: 94.60 / 95.14
H1 chart's support levels: 93.97 / 93.55
Trading recommendations for today: Based on the H1 chart, place sell (short) orders only if the USD Index breaks with a bearish candlestick; the support level is at 95.14, take profit is at 95.85 and stop loss is at 94.47.