 English
  Русский
 Bahasa Indonesia
 Bahasa Malay
 ไทย
ไทย Español
 Deutsch
 Български
 Français
 Tiếng Việt
 中文
中文 বাংলা
বাংলা हिन्दी
 Čeština
 Українська
 Română

The pair hasn't made any significative changes in its current structure and remains consolidated below the 200 SMA at H1 chart. The next support lies at 1.3037, at which the bears are trying to gather enough momentum in order to continue with the downside, towards the 1.2880 level. MACD indicator is in the neutral territory, calling for sideways moves.
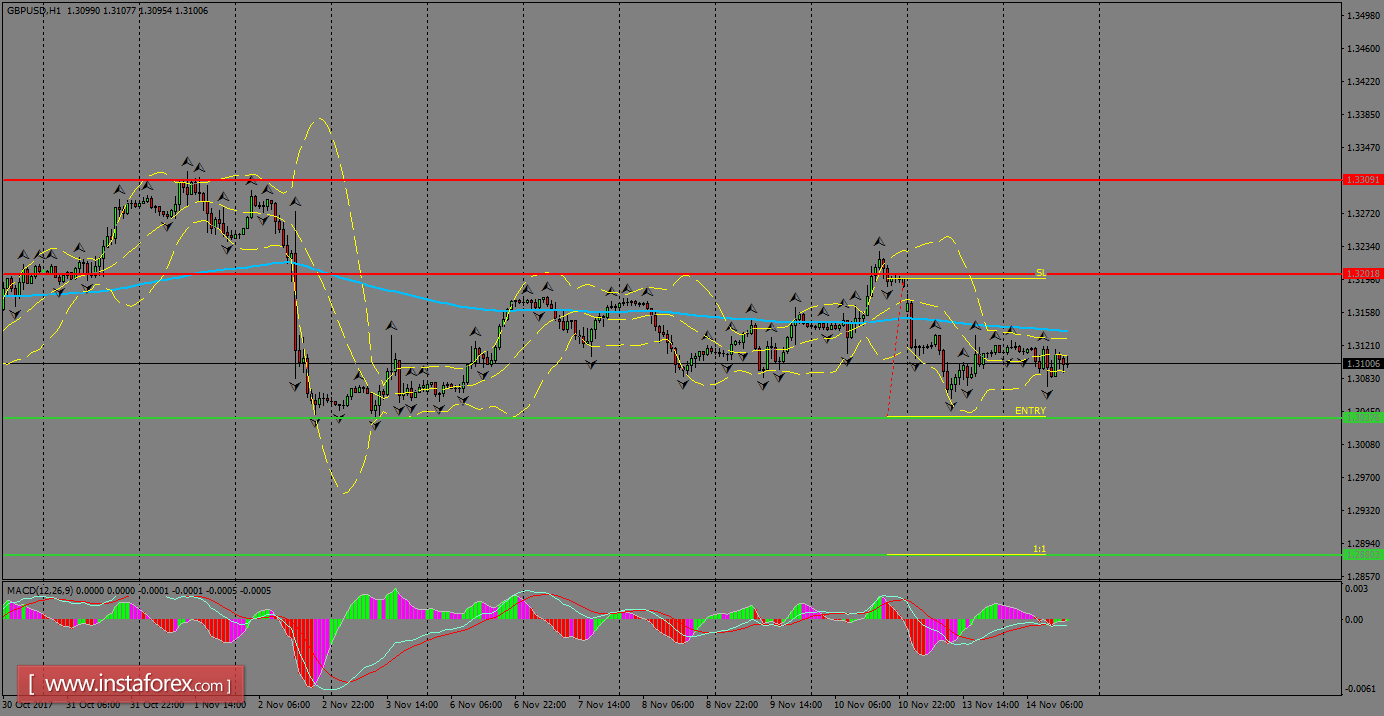
H1 chart's resistance levels: 1.3201 / 1.3309
H1 chart's support levels: 1.3037 / 1.2880
Trading recommendations for today: Based on the H1 chart, sell (short) orders only if the GBP/USD pair breaks a bearish candlestick; the support level is at 1.3037, take profit is at 1.2880 and stop loss is at 1.3193.