 English
  Русский
 Bahasa Indonesia
 Bahasa Malay
 ไทย
ไทย Español
 Deutsch
 Български
 Français
 Tiếng Việt
 中文
中文 বাংলা
বাংলা हिन्दी
 Čeština
 Українська
 Română

Overview:
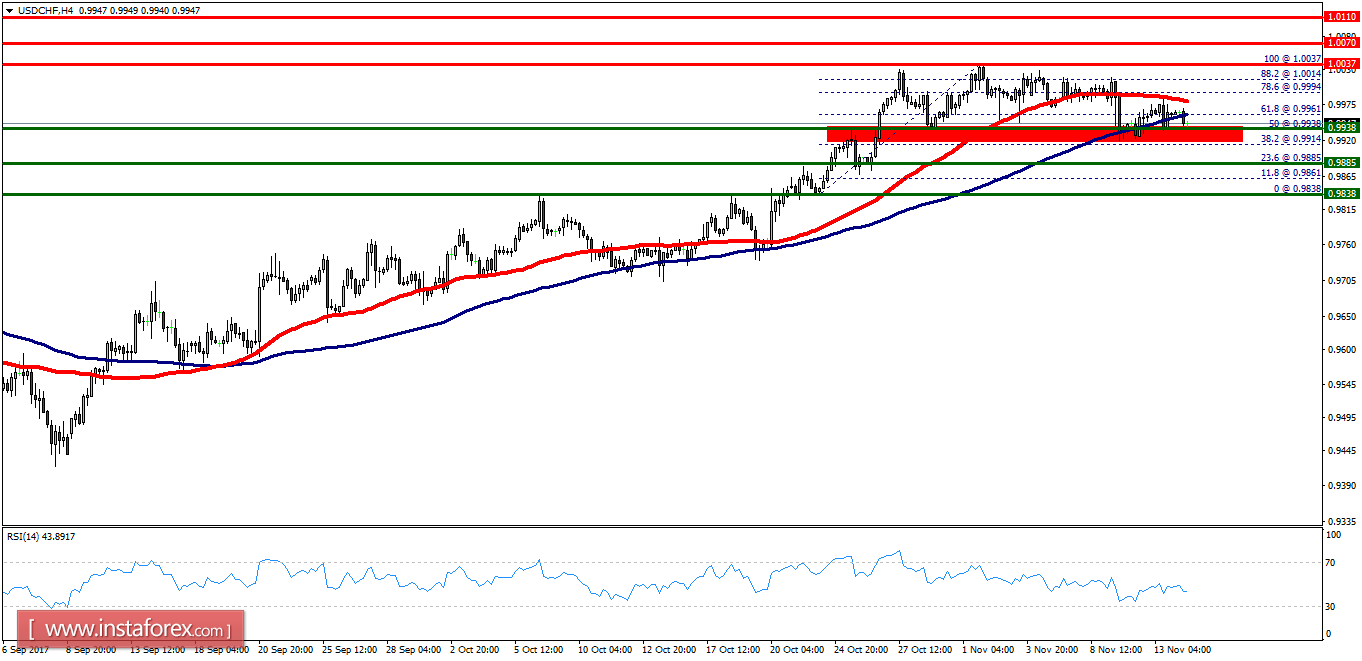
- The support level is seen at the price of 0.9938 on the H4 chart. Since last week, the trend of USD/CHF pair movement was controversial as it took place in a narrow sideways channel, the market showed signs of instability. Amid the previous events, the price is still moving between the levels of 0.9938 and 1.0037. Also, the daily resistance and support are seen at the levels of 1.0037 and 0.9938 respectively. Therefore, it is recommended to be cautious while placing orders in this area. So, we need to wait until the sideways channel has completed. Last month, the market moved from its bottom at 0.9938 and continued to rise towards the top of 1.0037. Today, in the one-hour chart, the current rise will remain within a framework of correction. However, if the pair fails to pass through the level of 1.0037, the market will indicate a bearish opportunity below the strong resistance level of 1.0037 (the level of 1.0037 coincides with the double top too). Since there is nothing new in this market, it is not bullish yet. Sell deals are recommended below the level of 1.0037 with the first target at 1.0037. If the trend breaks the support level of 1.0037, the pair is likely to move downwards continuing the development of a bearish trend to the level 0.9880.