 English
  Русский
 Bahasa Indonesia
 Bahasa Malay
 ไทย
ไทย Español
 Deutsch
 Български
 Français
 Tiếng Việt
 中文
中文 বাংলা
বাংলা हिन्दी
 Čeština
 Українська
 Română

GBP/USD started the week with a bearish tone in the short-term, consolidating its price action below the 200 SMA at H1 chart and it seems we can see a testing of the support level at 1.3037. If that zone gives up, then another leg lower is possible, targeting the next barrier for sellers at 1.2880. MACD indicator is turning neutral, calling for further sideways' moves.
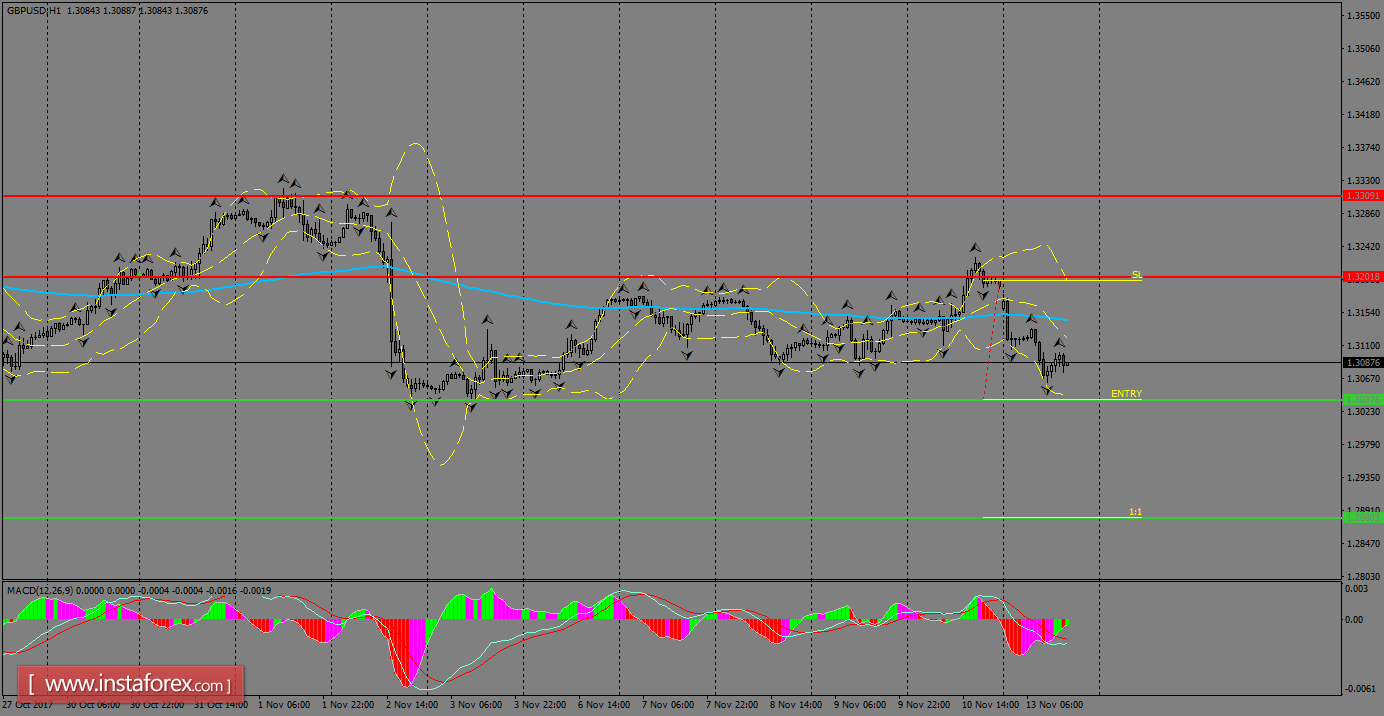
H1 chart's resistance levels: 1.3201 / 1.3309
H1 chart's support levels: 1.3037 / 1.2880
Trading recommendations for today: Based on the H1 chart, sell (short) orders only if the GBP/USD pair breaks a bearish candlestick; the support level is at 1.3037, take profit is at 1.2880 and stop loss is at 1.3193.