 English
  Русский
 Bahasa Indonesia
 Bahasa Malay
 ไทย
ไทย Español
 Deutsch
 Български
 Français
 Tiếng Việt
 中文
中文 বাংলা
বাংলা हिन्दी
 Čeština
 Українська
 Română

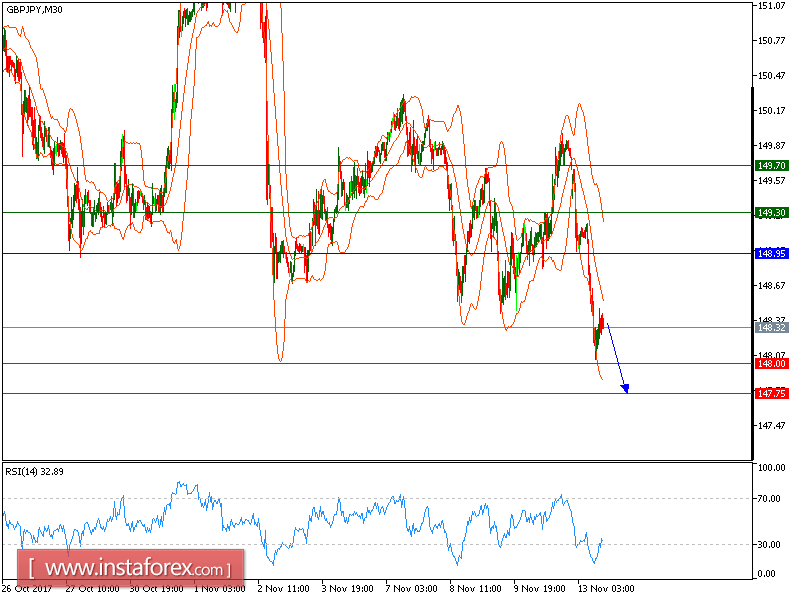
GBP/JPY is under pressure and expected to continue the downside movement. The pair is under pressure below the key resistance at 148.95, which should maintain the upside potential. The relative strength index is bearish below its neutrality level at 50 and lacks upward momentum.
Therefore, as long as 148.95 holds on the upside, look for a new decline to 148.00 and even to 147.75 in extension.
Alternatively, if the price moves in the direction opposite to the forecast, a long position is recommended above 148.95 with the target at 148.00.
Strategy: SELL, Stop Loss: 148.95, Take Profit: 148.00
Chart Explanation: the black line shows the pivot point. The price above the pivot point indicates long positions; and when it is below the pivot points, it indicates short positions. The red lines show the support levels and the green line indicates the resistance levels. These levels can be used to enter and exit trades.
Resistance levels: 149.30, 149.70 and 150.20
Support levels: 148.00, 148.15, and 147.45