 English
  Русский
 Bahasa Indonesia
 Bahasa Malay
 ไทย
ไทย Español
 Deutsch
 Български
 Français
 Tiếng Việt
 中文
中文 বাংলা
বাংলা हिन्दी
 Čeština
 Українська
 Română

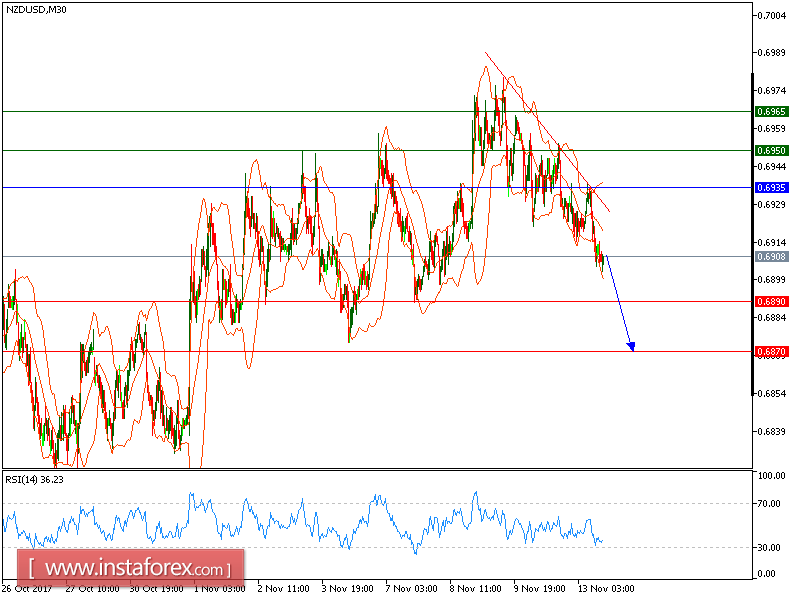
NZD/USD is Under pressure and expected to trade in a lower range. The pair is clearly in a down trend, and also remains under pressure below its key resistance at 0.6950. Both the 20-period and 50-period moving averages are heading downward now, and should continue to push the prices lower. Last but not least, the relative strength index is mixed to bearish, and is below its neutrality area at 50.
Hence, as long as 0.6935 is not surpassed, look for a new pullback to 0.6890 and 0.6870 in extension.
The black line shows the pivot point. Currently, the price is above the pivot point, which indicates long positions. If it remains below the pivot point, it will indicate short positions. The red lines are showing the support levels and the green line is indicating the resistance levels. These levels can be used to enter and exit trades.
Resistance levels: 0.6950, 0.6965, and 0.7000
Support levels: 0.6890, 0.687, and 0.6835