 English
  Русский
 Bahasa Indonesia
 Bahasa Malay
 ไทย
ไทย Español
 Deutsch
 Български
 Français
 Tiếng Việt
 中文
中文 বাংলা
বাংলা हिन्दी
 Čeština
 Українська
 Română

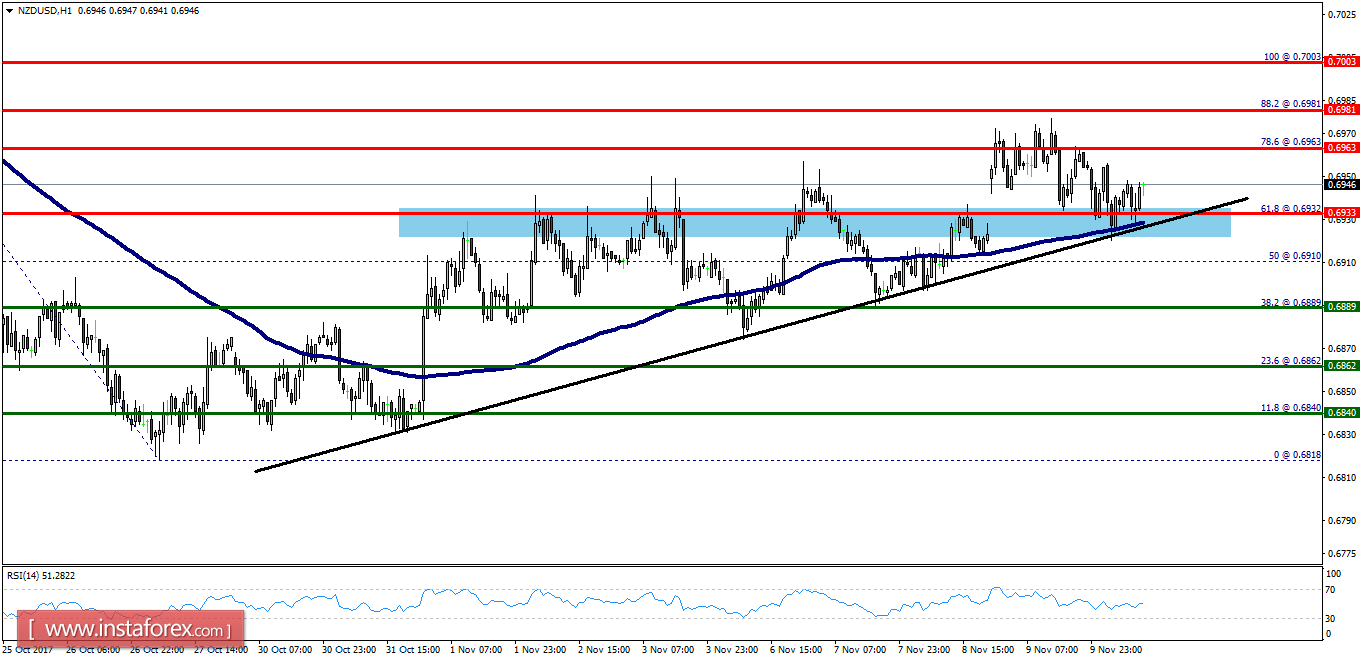
Overview:
- The NZD/USD pair tested the level of 0.6933 on the H1 chart. This pair will probably continue to move upwards from the level of 0.6933. However, the first resistance level is seen at 0.6963 followed by 0.6981 and 0.7003, while the weekly support 1 is seen at 0.6889 (major support this week). According to the previous events, the NZD/USD pair is still moving between the levels of 0.6933 and 0.7003. Furthermore, if the trend is able to break out the first resistance level at 0.6963, we could see the pair climbing towards the resistance levels of 0.6981 and 0.7003. Therefore, buy above the level of 0.6933 (major support) with the first target at 0.6981 in order to test the daily resistance 2 and further to 0.7003. Also, it should be noted that the level of 0.7003 is a good place to take profit on the H1 chart. On the other hand, in case a reversal takes place and the NZD/USD pair breaks through the support level of 0.6933, a further decline to 0.6862 can occur which would indicate a bearish market. On the whole, we are still looking for a strong bullish market as long as the trend is above the price of 0.6933.