 English
  Русский
 Bahasa Indonesia
 Bahasa Malay
 ไทย
ไทย Español
 Deutsch
 Български
 Français
 Tiếng Việt
 中文
中文 বাংলা
বাংলা हिन्दी
 Čeština
 Українська
 Română

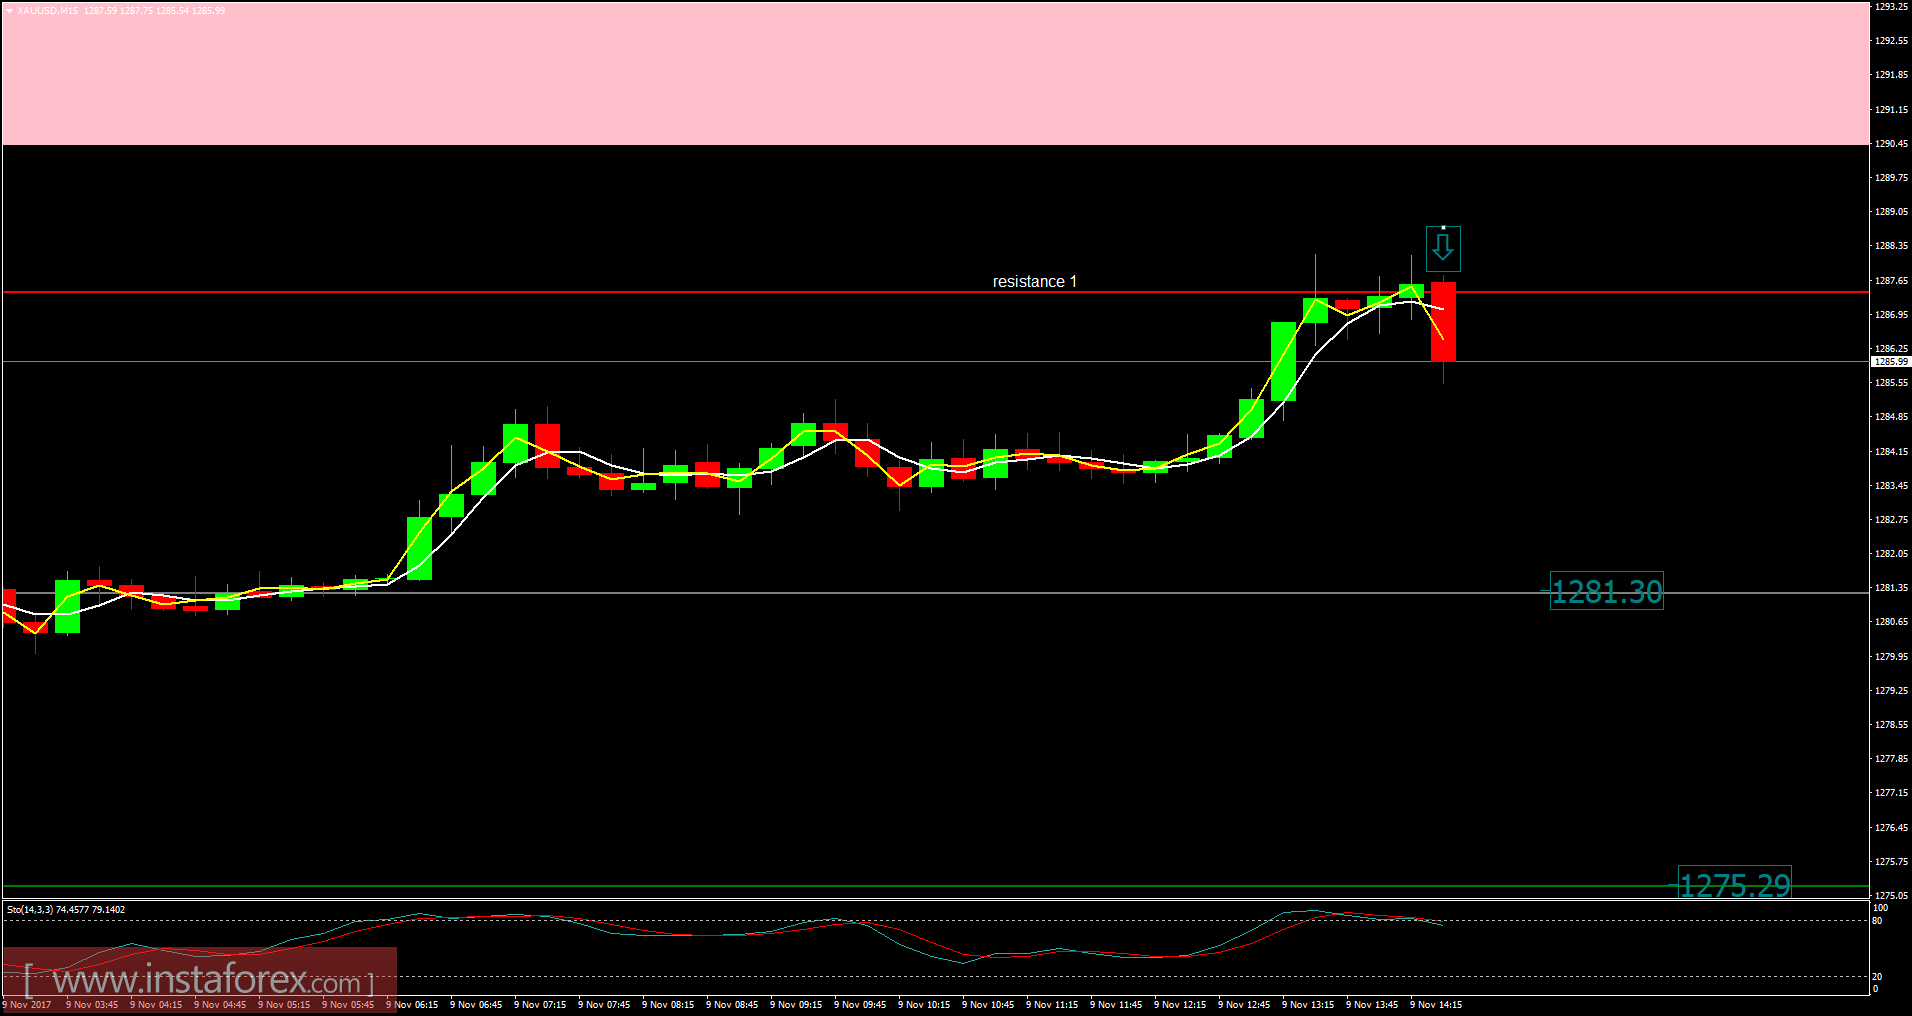
Recently, the Gold has been trading upwards. The price tested the level of $1,288.70. According to the 15M time – frame, I found doji candles at the pivot resistance ($1,287.35), which is sign that buying looks risky. I also found overbought stochastic oscillator, which is another sign of weakness. My advice is to watch for potential selling opportuntiies.
Resistance levels:
R1: $1,287.40
R2: $1,293.40
R3: $1,299.55
Support levels:
S1: $1,275.24
S2: $1,269.10
S3: $1,263.10
Trading recommendations for today: watch for potential selling opportunities.