English
  Русский
 Bahasa Indonesia
 Bahasa Malay
 ไทย
ไทย Español
 Deutsch
 Български
 Français
 Tiếng Việt
 中文
中文 বাংলা
বাংলা हिन्दी
 Čeština
 Українська
 Română

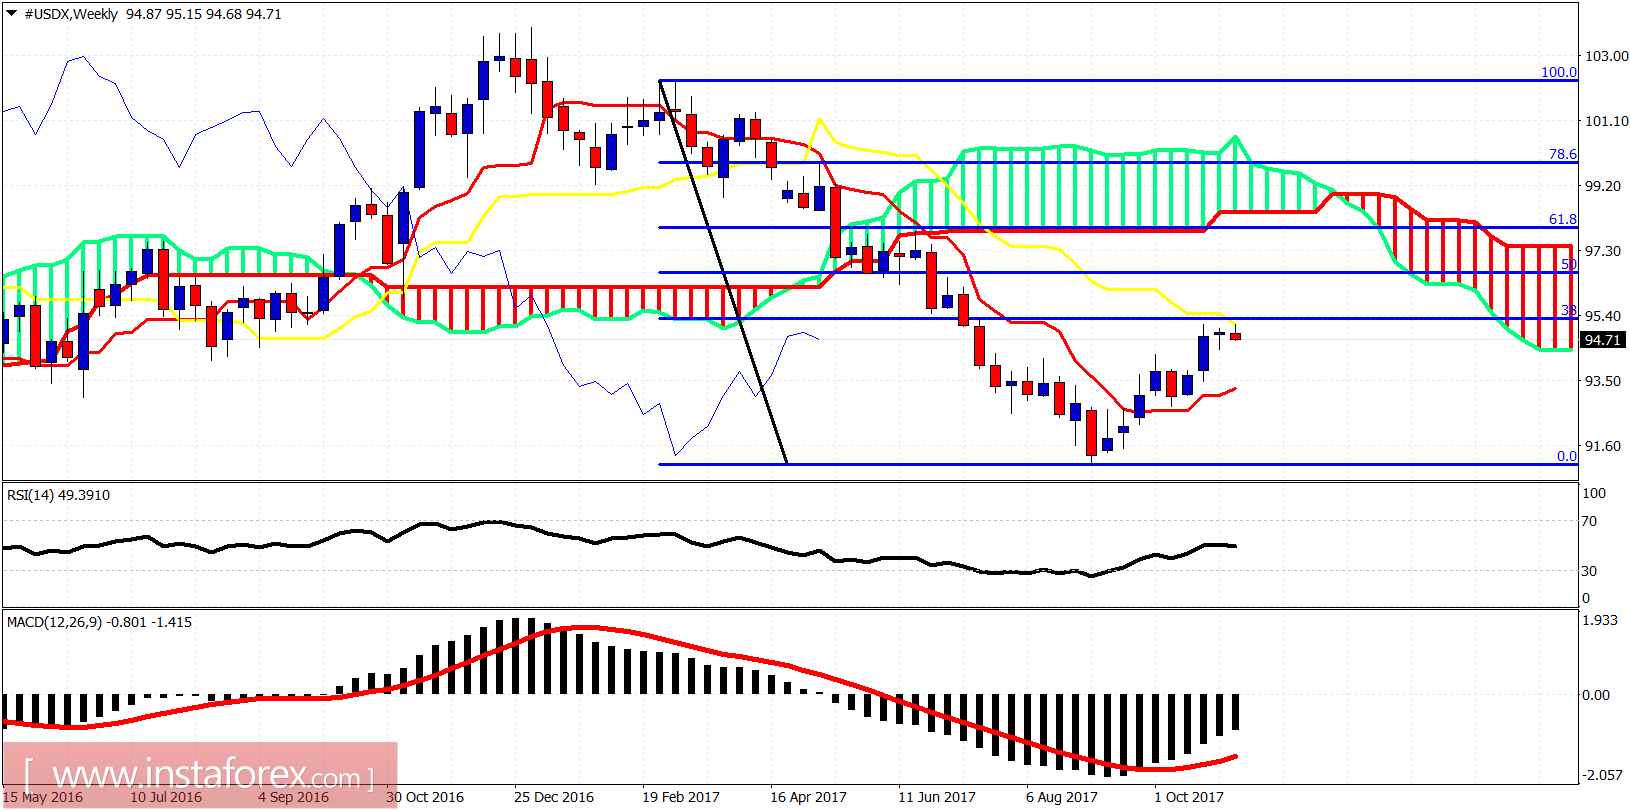
The Dollar index has broken the short-term bullish channel and has entered the 4-hour Kumo (cloud) support area. Trend has changed from bullish to neutral. The Dollar index is showing reversal signs off important medium-term resistance.
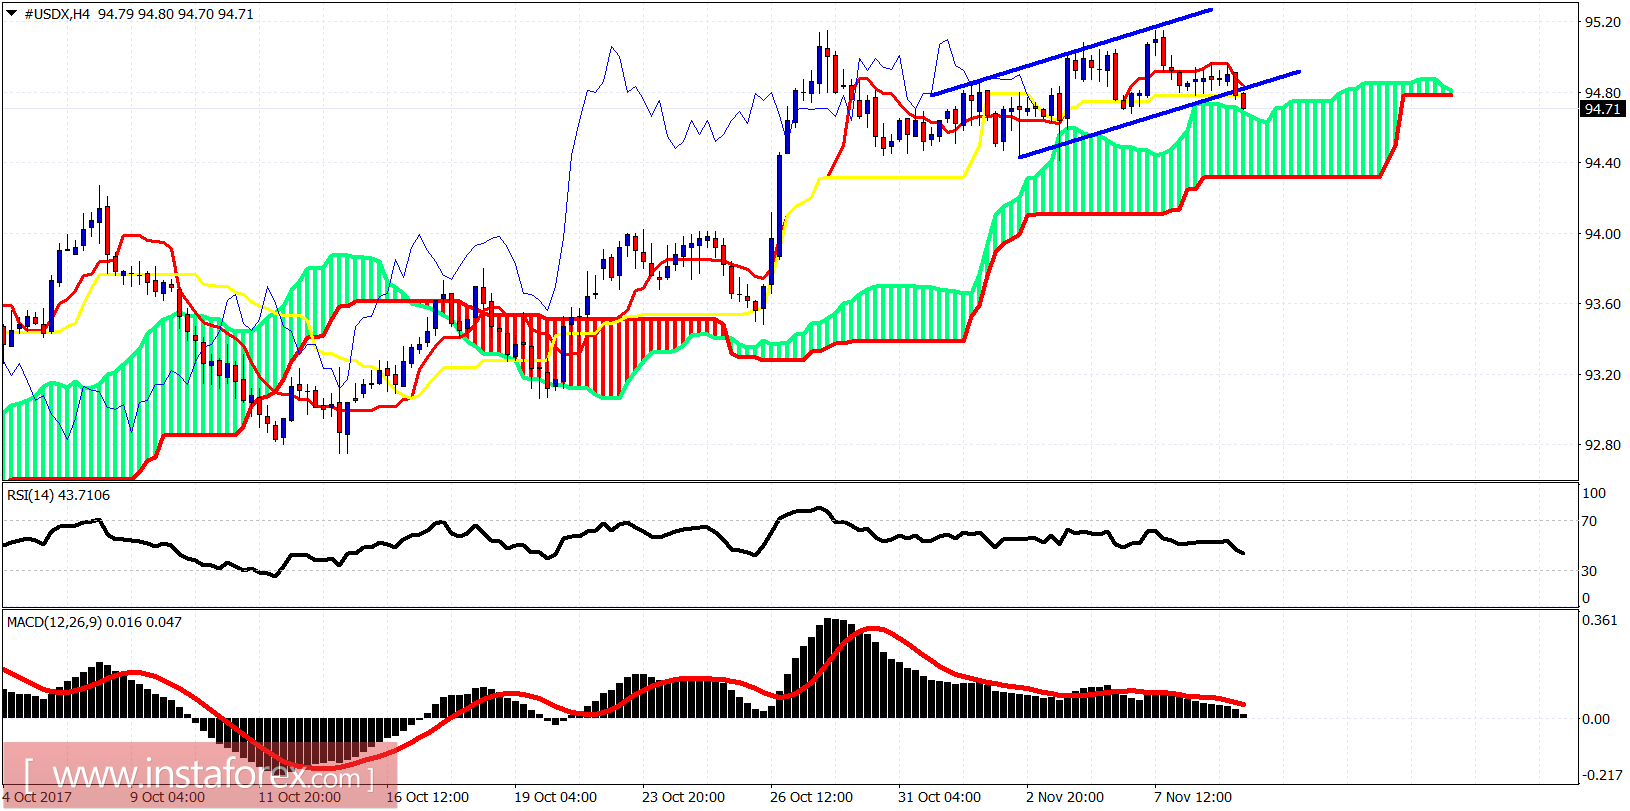
The Dollar index is about to enter the 4-hour Ichimoku cloud. This will change short-term trend to neutral. Support is at 94.69 and next at 94.30. As long as we are above these levels I believe there are still chances of seeing a move towards the big resistance at 95.50.