 English
  Русский
 Bahasa Indonesia
 Bahasa Malay
 ไทย
ไทย Español
 Deutsch
 Български
 Français
 Tiếng Việt
 中文
中文 বাংলা
বাংলা हिन्दी
 Čeština
 Українська
 Română

Gold price has been making higher highs and higher lows since a pullback from the low at $1,263. The short-term trend has changed to bullish and is challenging important resistance at $1,283-86. Gold is in a bullish short-term trend as long as price is above $1,272.
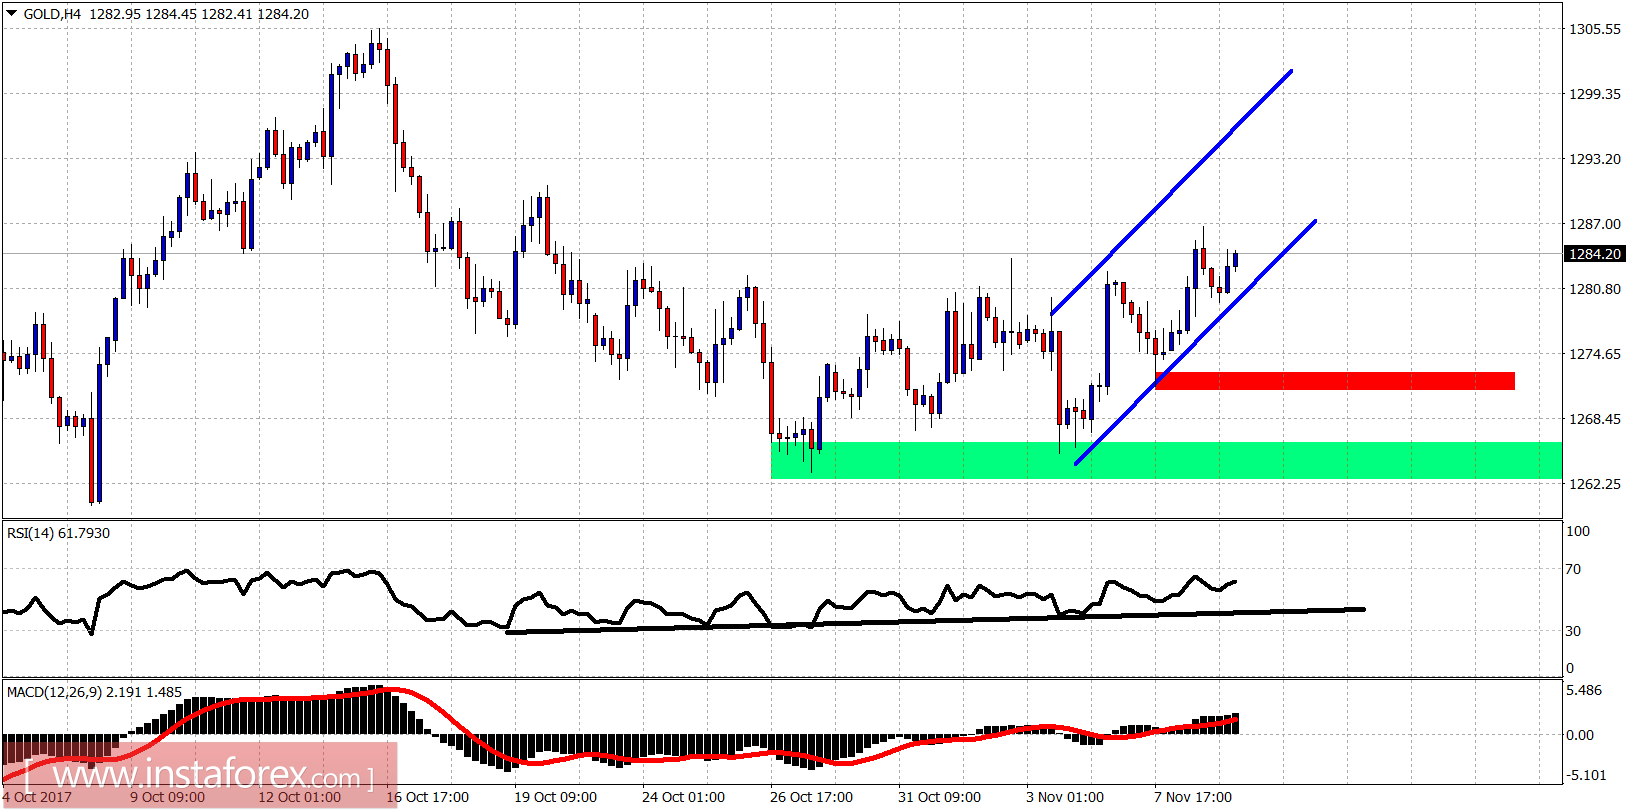
Red rectangle - short-term support
Green rectangle - important medium-term support
Gold price is trading inside a bullish channel. The trend is bullish. Support is at $1,272. Breaking below the red rectangle will increase the chances of breaking below the green rectangle support at $1,262. Breaking below $1,262 will open the way for a push towards $1,245.
