 English
  Русский
 Bahasa Indonesia
 Bahasa Malay
 ไทย
ไทย Español
 Deutsch
 Български
 Français
 Tiếng Việt
 中文
中文 বাংলা
বাংলা हिन्दी
 Čeština
 Українська
 Română

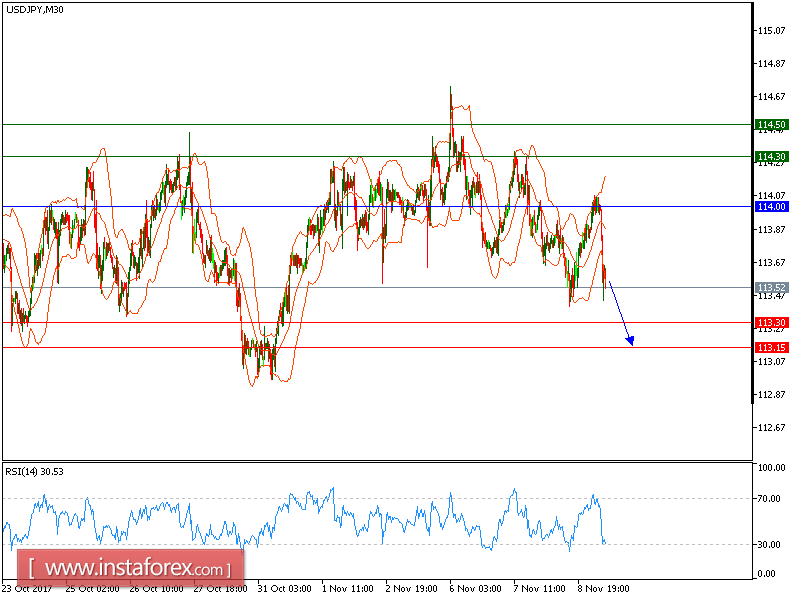
Our first target which we predicted in yesterday's analysis has been hit. USD/JPY is still expected to trade in a lower range. Despite the pair posting a rebound, the upward potential is likely to be limited by the resistance at 114.00. The declining 50-period moving average is playing a resistance role. The relative strength index is below its neutrality level at 50.
To sum up, below 114.00, look for a further decline with targets at 113.30 and 113.15 in extension.
Alternatively, if the price moves in the opposite direction, a short position is recommended above 114.00 with a target at 114.30.
Chart Explanation: The black line shows the pivot point. The current price above the pivot point indicates a bullish position, while the price below the pivot point is a signal for a short position. The red lines show the support levels and the green line indicates the resistance level. These levels can be used to enter and exit trades.
Strategy: SELL, Stop Loss: 114.00, Take Profit: 113.30
Resistance levels: 114.30, 114.50 and 114.90 Support Levels: 113.65, 11.30, 112.95