 English
  Русский
 Bahasa Indonesia
 Bahasa Malay
 ไทย
ไทย Español
 Deutsch
 Български
 Français
 Tiếng Việt
 中文
中文 বাংলা
বাংলা हिन्दी
 Čeština
 Українська
 Română

The pair is facing a dynamic resistance in the 200 SMA at H1 chart and it's again on the way to test the support level of 1.3037, which adds strength to the bias proposed. If that zone gives up, then we might expect a leg lower towards the 1.2880 level, but if it manages to do a rebound then it can break the resistance area of 1.3201.
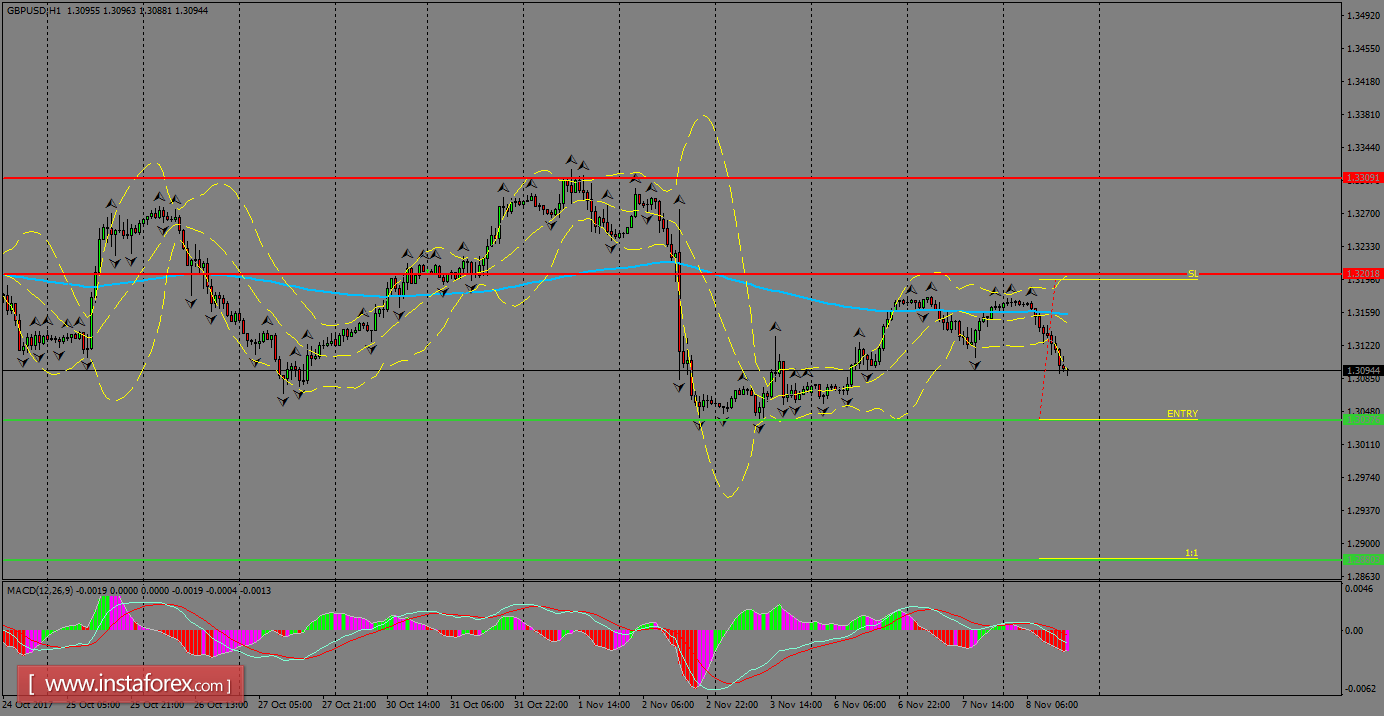
H1 chart's resistance levels: 1.3201 / 1.3309
H1 chart's support levels: 1.3037 / 1.2880
Trading recommendations for today: Based on the H1 chart, sell (short) orders only if the GBP/USD pair breaks a bearish candlestick; the support level is at 1.3037, take profit is at 1.2880 and stop loss is at 1.3193.