English
  Русский
 Bahasa Indonesia
 Bahasa Malay
 ไทย
ไทย Español
 Deutsch
 Български
 Français
 Tiếng Việt
 中文
中文 বাংলা
বাংলা हिन्दी
 Čeština
 Українська
 Română

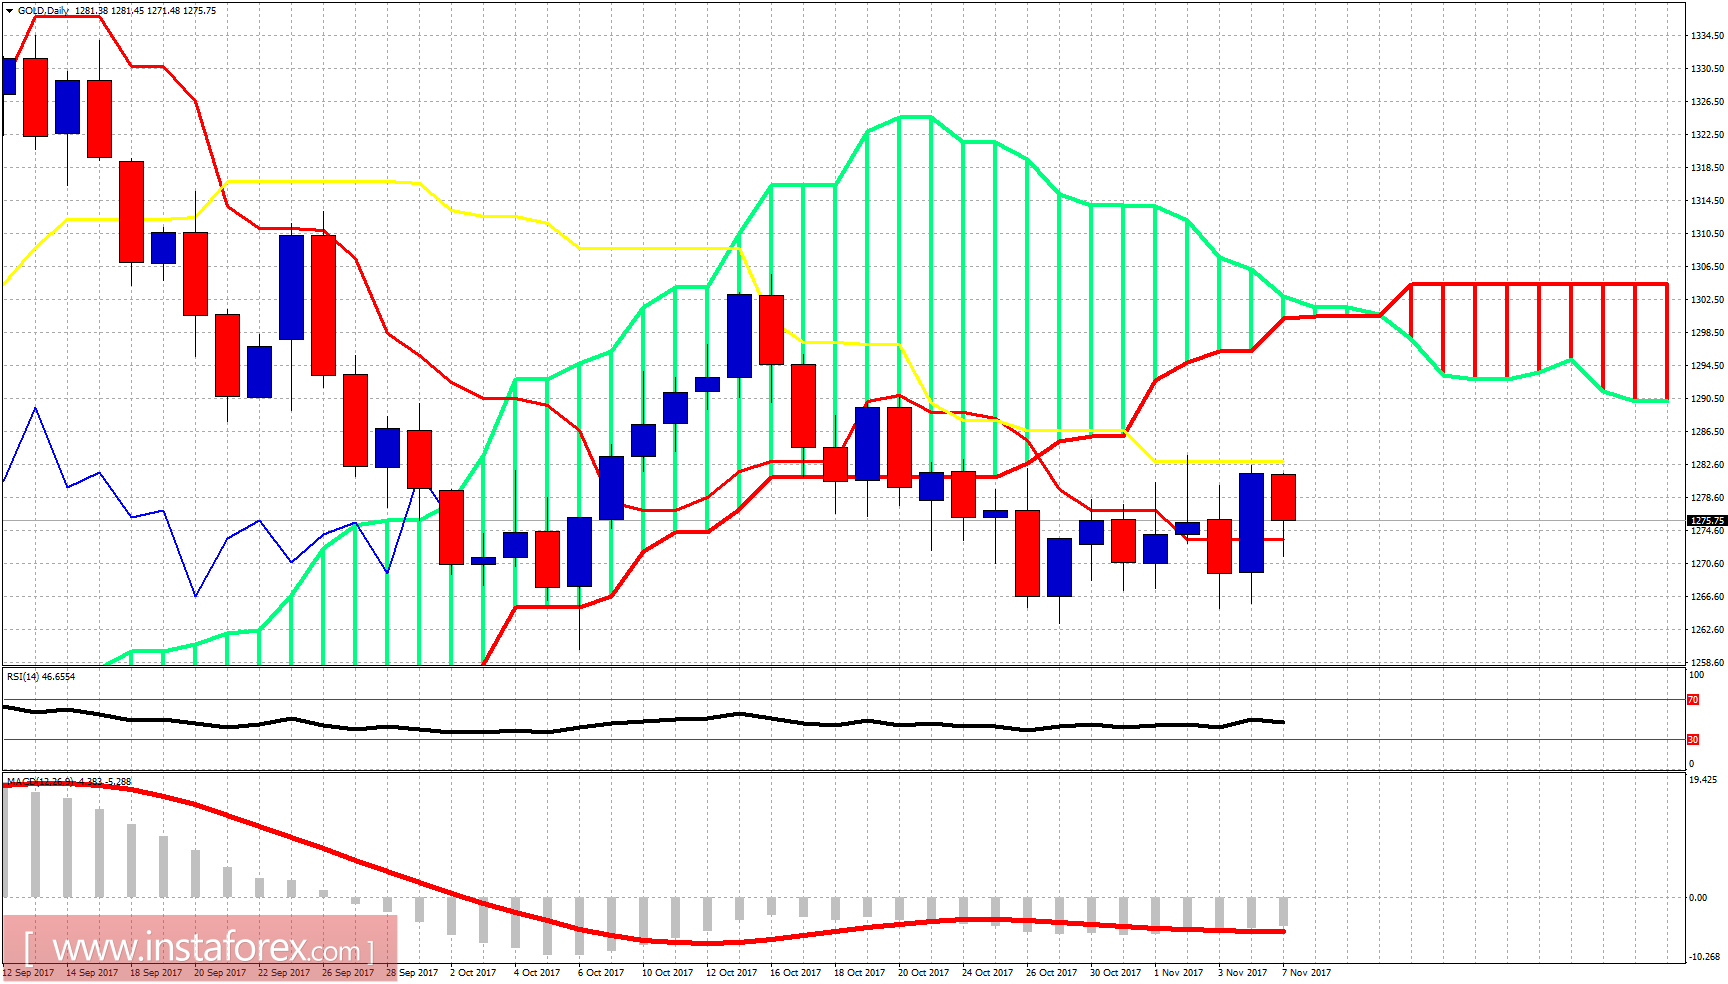
The Gold price is in a neutral short-term trend as the price is inside the 4-hour Kumo (cloud). I continue to be a long-term Gold bull but as long as we trade below $1,284 there many chances of visiting the $1,240 area.
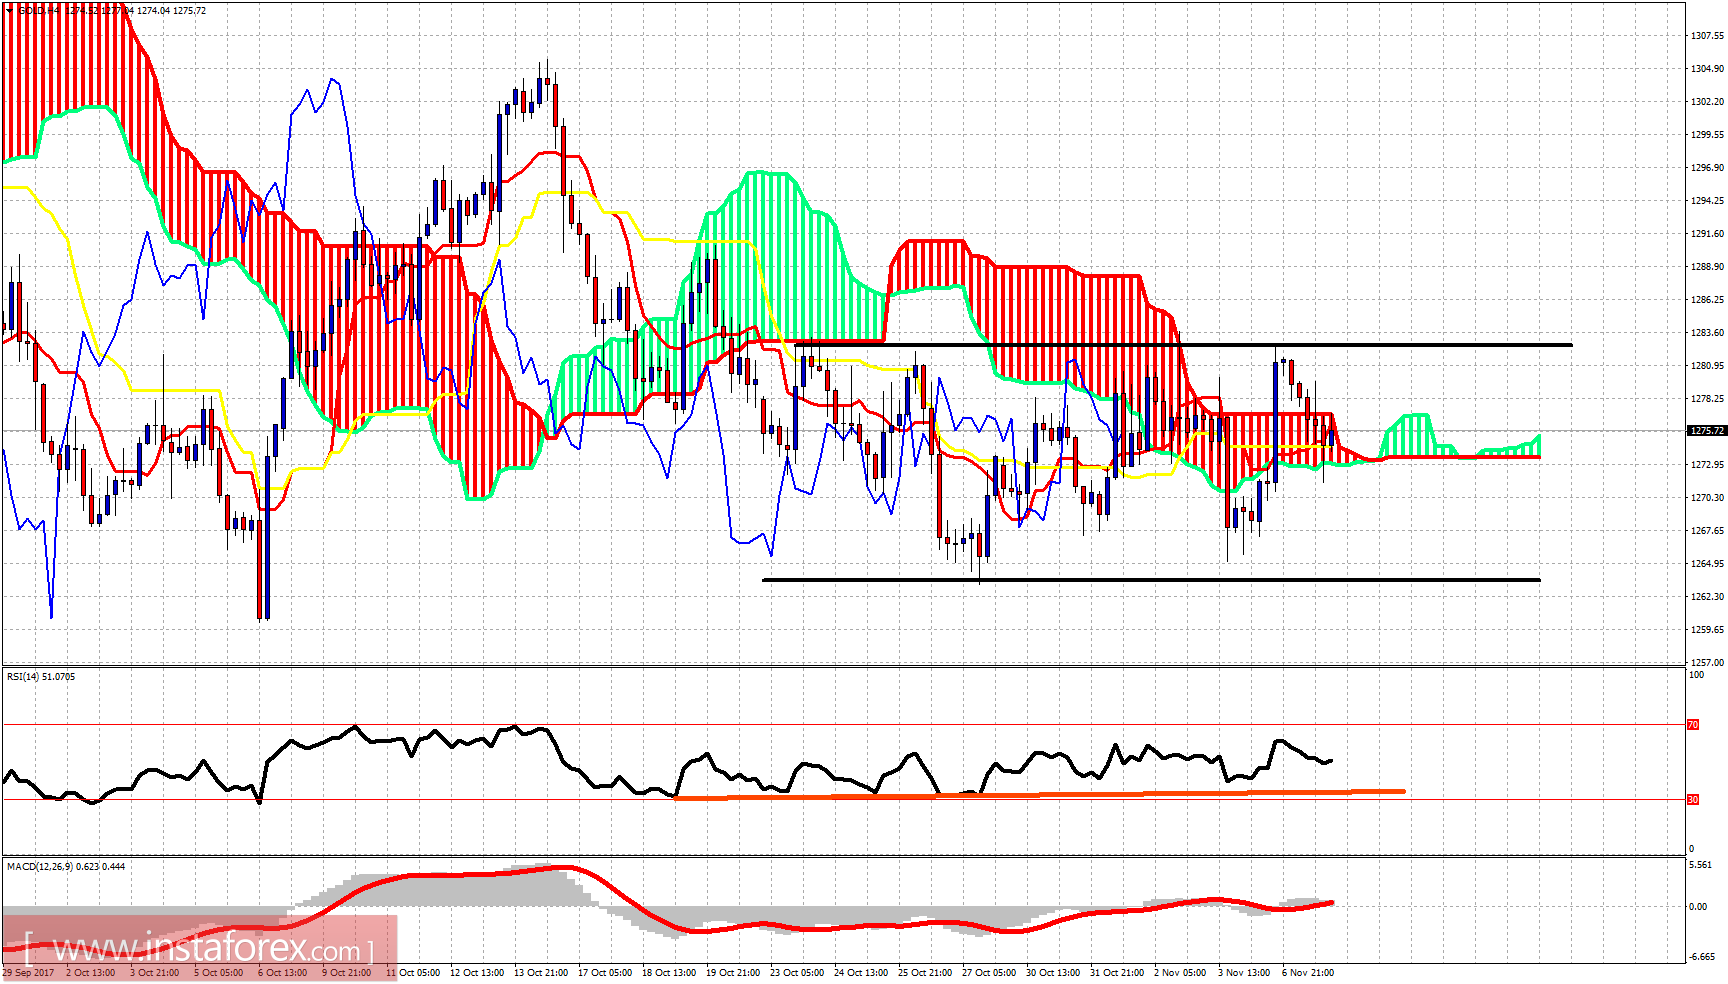
Black lines - trading range
The Gold price is trapped inside the trading range of $1,283 and $1,263. The trend is neutral as the price is inside the cloud. Bulls need to break above $1,284 in order for the momentum to turn bullish again. Otherwise, another rejection at $1,283 will increase the chances for a new low towards $1,250.