 English
  Русский
 Bahasa Indonesia
 Bahasa Malay
 ไทย
ไทย Español
 Deutsch
 Български
 Français
 Tiếng Việt
 中文
中文 বাংলা
বাংলা हिन्दी
 Čeština
 Українська
 Română

GBP/USD is consolidating the price action around the 200 SMA once again, still under heavy pressure by the sellers. During Tuesday's session, it has formed two fractals that are acting as strong resistance levels and if it manages to break those levels, the pair could scope to test the resistance level of 1.3309. MACD indicator remains in favor of the bears.
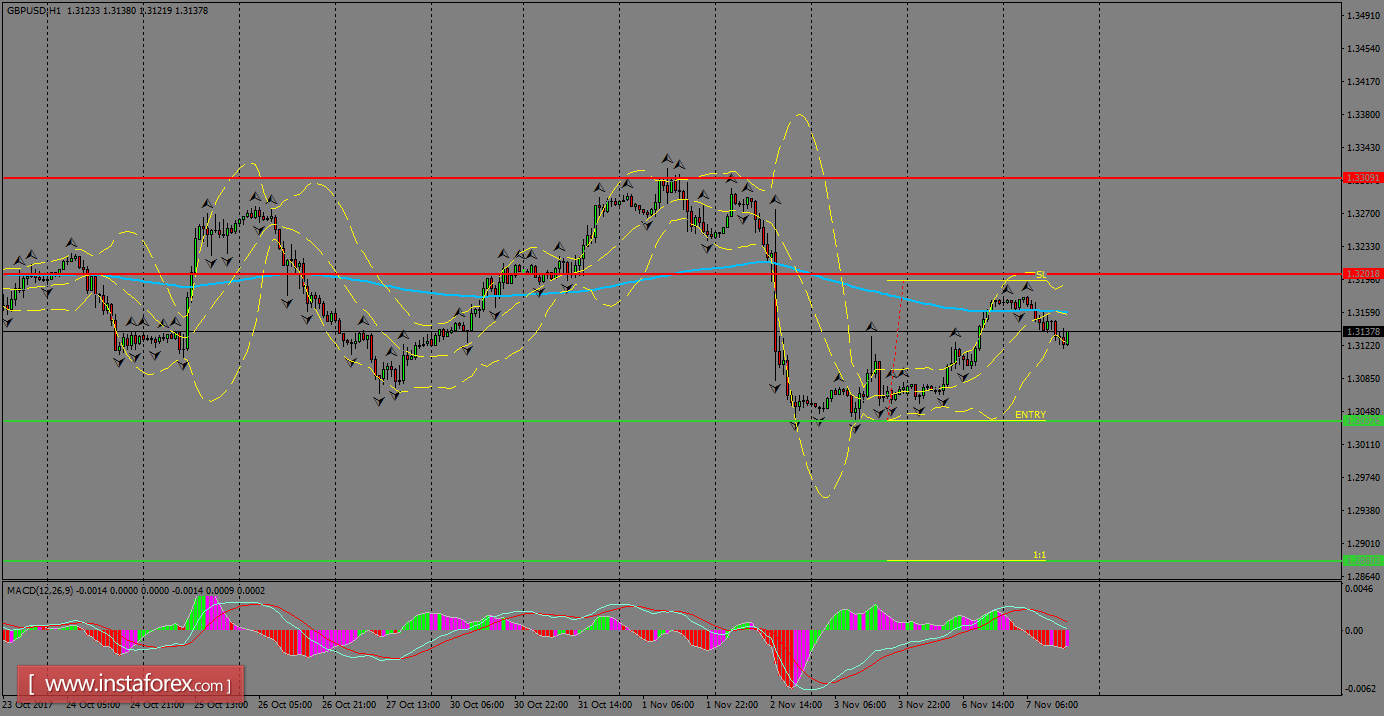
H1 chart's resistance levels: 1.3201 / 1.3309
H1 chart's support levels: 1.3037 / 1.2880
Trading recommendations for today: Based on the H1 chart, sell (short) orders only if the GBP/USD pair breaks a bearish candlestick; the support level is at 1.3037, take profit is at 1.2880 and stop loss is at 1.3193.