English
  Русский
 Bahasa Indonesia
 Bahasa Malay
 ไทย
ไทย Español
 Deutsch
 Български
 Français
 Tiếng Việt
 中文
中文 বাংলা
বাংলা हिन्दी
 Čeština
 Українська
 Română

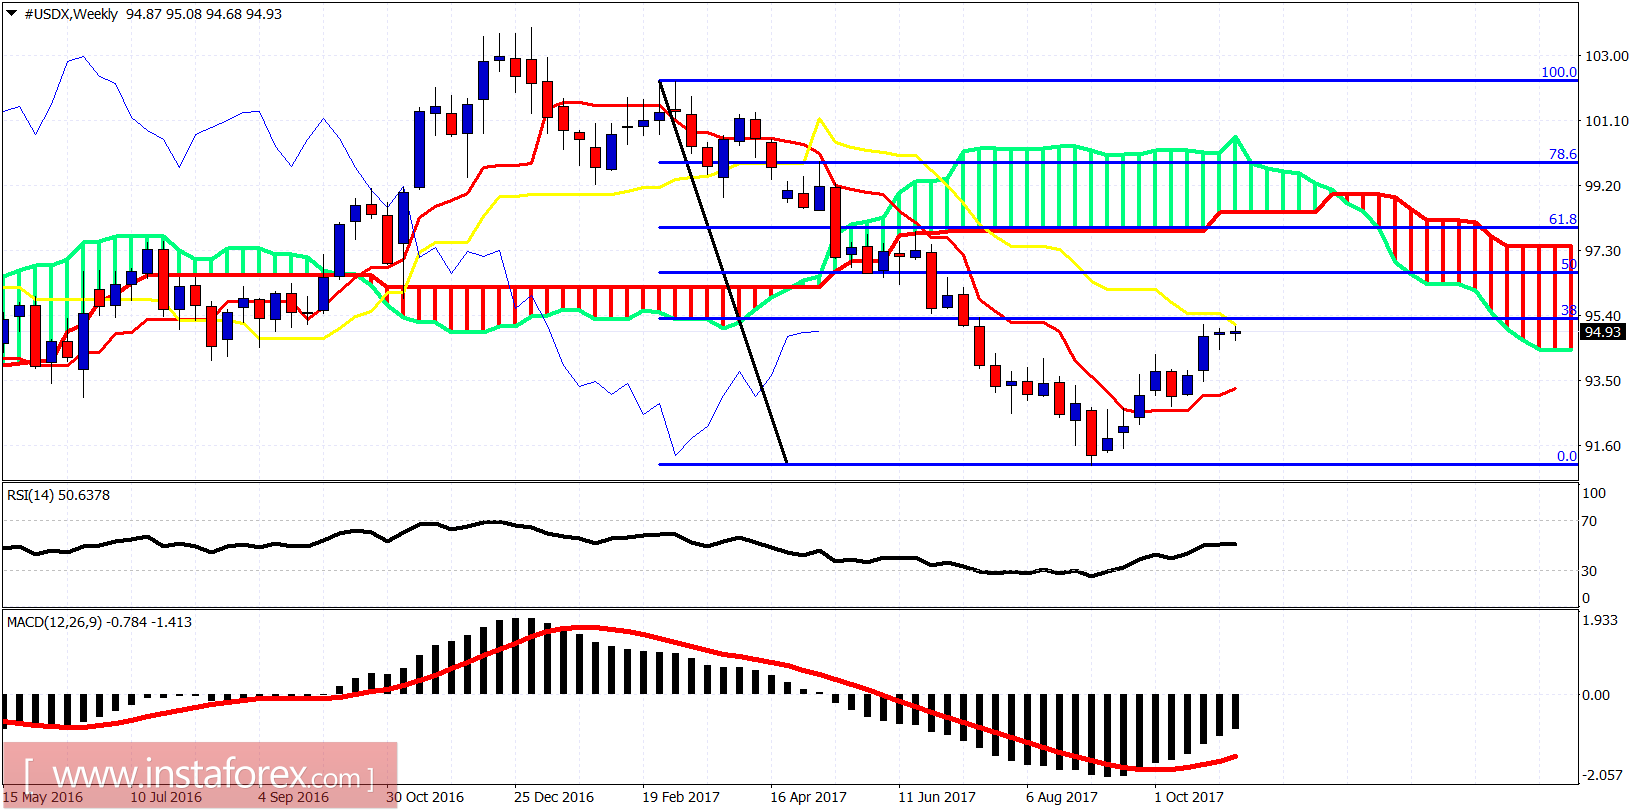
The Dollar index has broken out of the bullish channel but price remains above the Ichimoku cloud and has not broken below any previous low or important support. Price is mainly moving sideways.
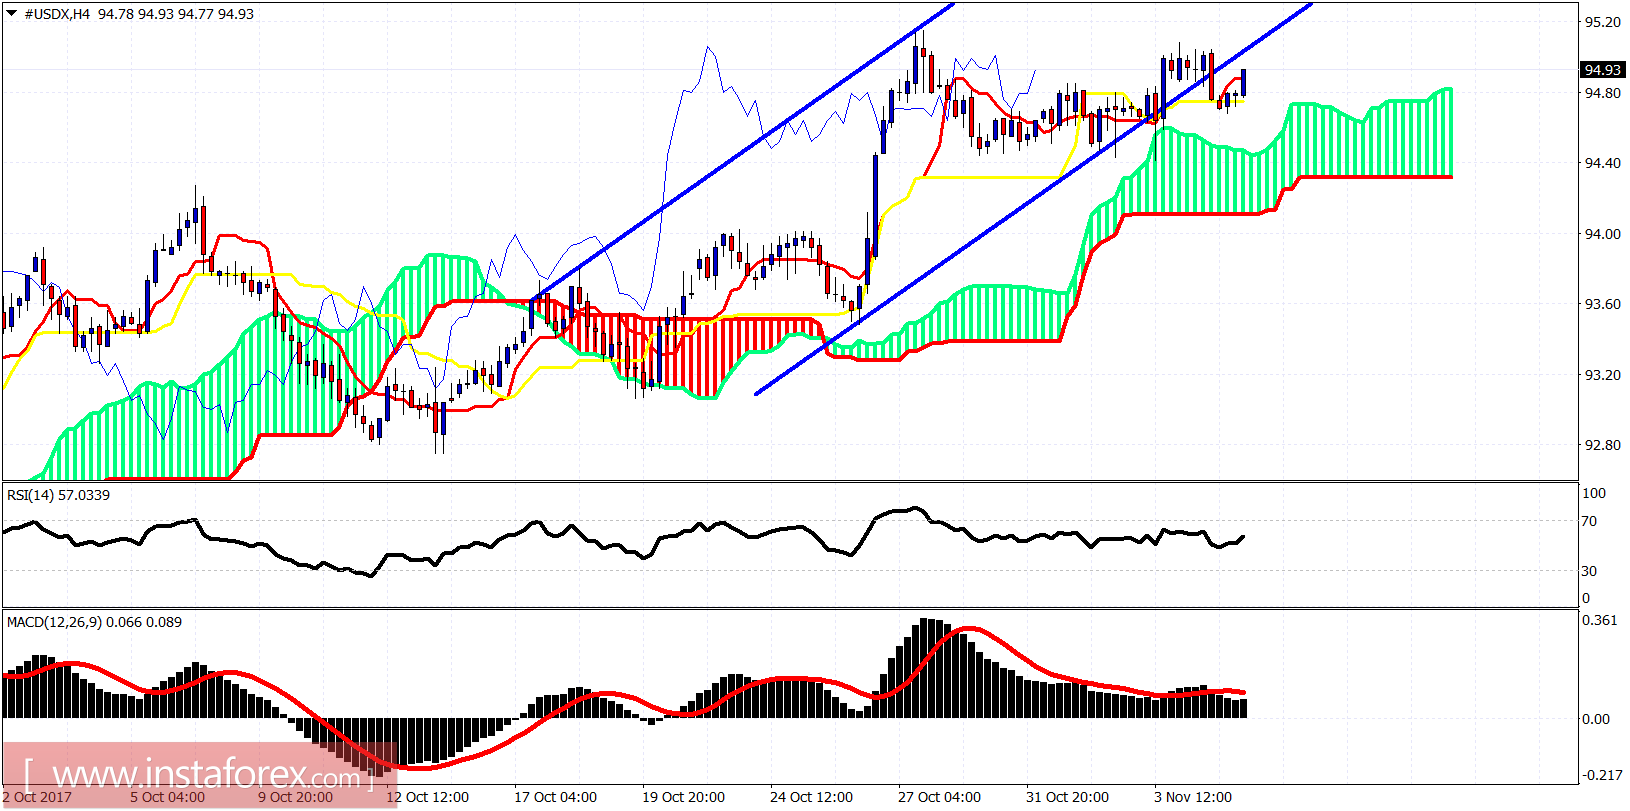
The Dollar index is above the 4-hour Kumo (cloud) support. Price has broken out of the bullish channel but no support level is broken. Trend remains bullish as long as price is above 94.10. Resistance is at 95.10. First support is at 94.40 and next and very important at 94.10.