 English
  Русский
 Bahasa Indonesia
 Bahasa Malay
 ไทย
ไทย Español
 Deutsch
 Български
 Français
 Tiếng Việt
 中文
中文 বাংলা
বাংলা हिन्दी
 Čeština
 Українська
 Română

The index stays alive in the bullish bias held since last week above the 200 SMA at H1 chart. The nearest resistance is placed at the 95.14 level, where a break should expose the 95.85 level across the board. Currently, price action doesn't suggest further weakness in USDX, but a decline to test the 200 SMA is a possibility in coming hours.
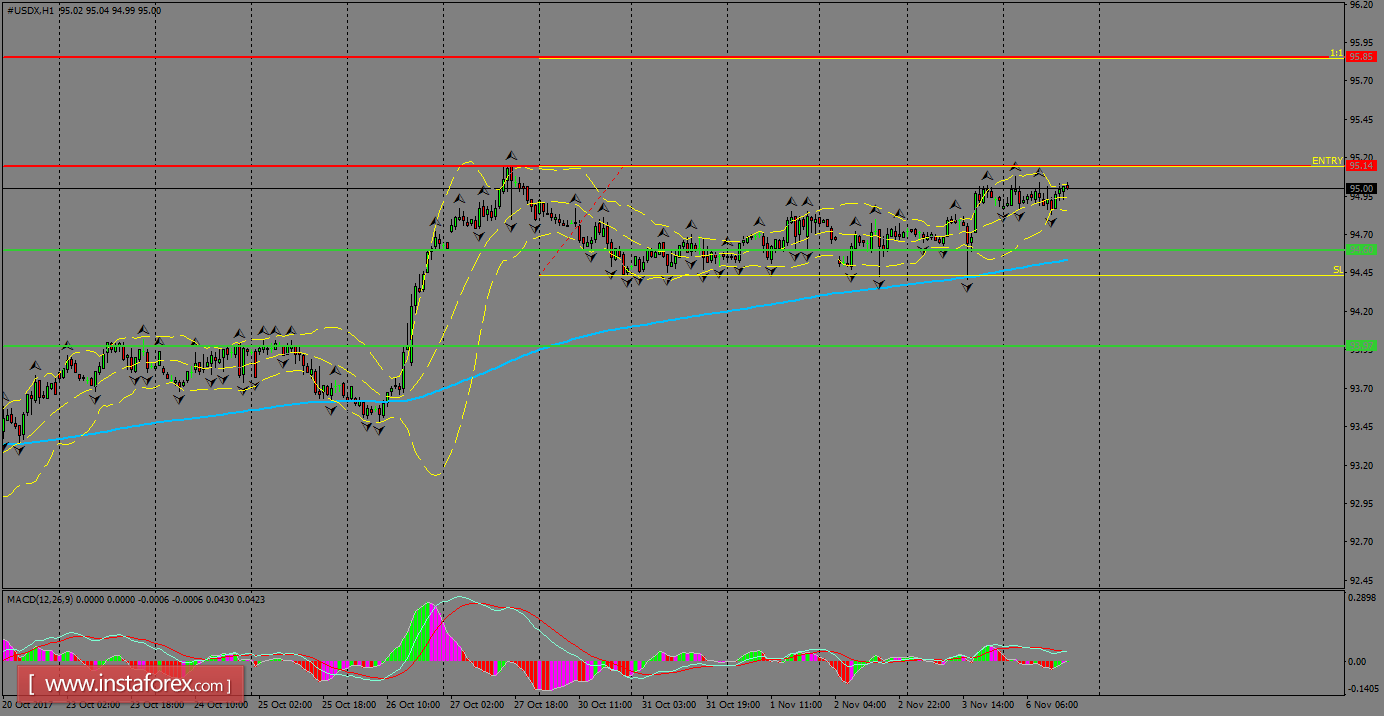
H1 chart's resistance levels: 95.14 / 95.85
H1 chart's support levels: 94.60 / 93.97
Trading recommendations for today: Based on the H1 chart, place buy (long) orders only if the USD Index breaks with a bullish candlestick; the resistance level is at 95.14, take profit is at 95.85 and stop loss is at 94.47.