English
  Русский
 Bahasa Indonesia
 Bahasa Malay
 ไทย
ไทย Español
 Deutsch
 Български
 Français
 Tiếng Việt
 中文
中文 বাংলা
বাংলা हिन्दी
 Čeština
 Українська
 Română

The week starts with a slightly stronger US dollar, especially against the yen as USD/JPY hit 114.70 and the New Zealand Dollar hit 0.6900 level. Raw material prices continue to dominate the commodity markets. WTI close to $56, and there is a huge increase in natural gas prices and a sharp increase in copper prices. An ounce of gold is priced at $1,270.
On Monday, sixth of November, the event calendar is light in important news releases. However, market participants will pay attention to the PMI Services and Composite data released from across the Eurozone. During the US session, Canada will release Ivey Purchasing Managers Index data.
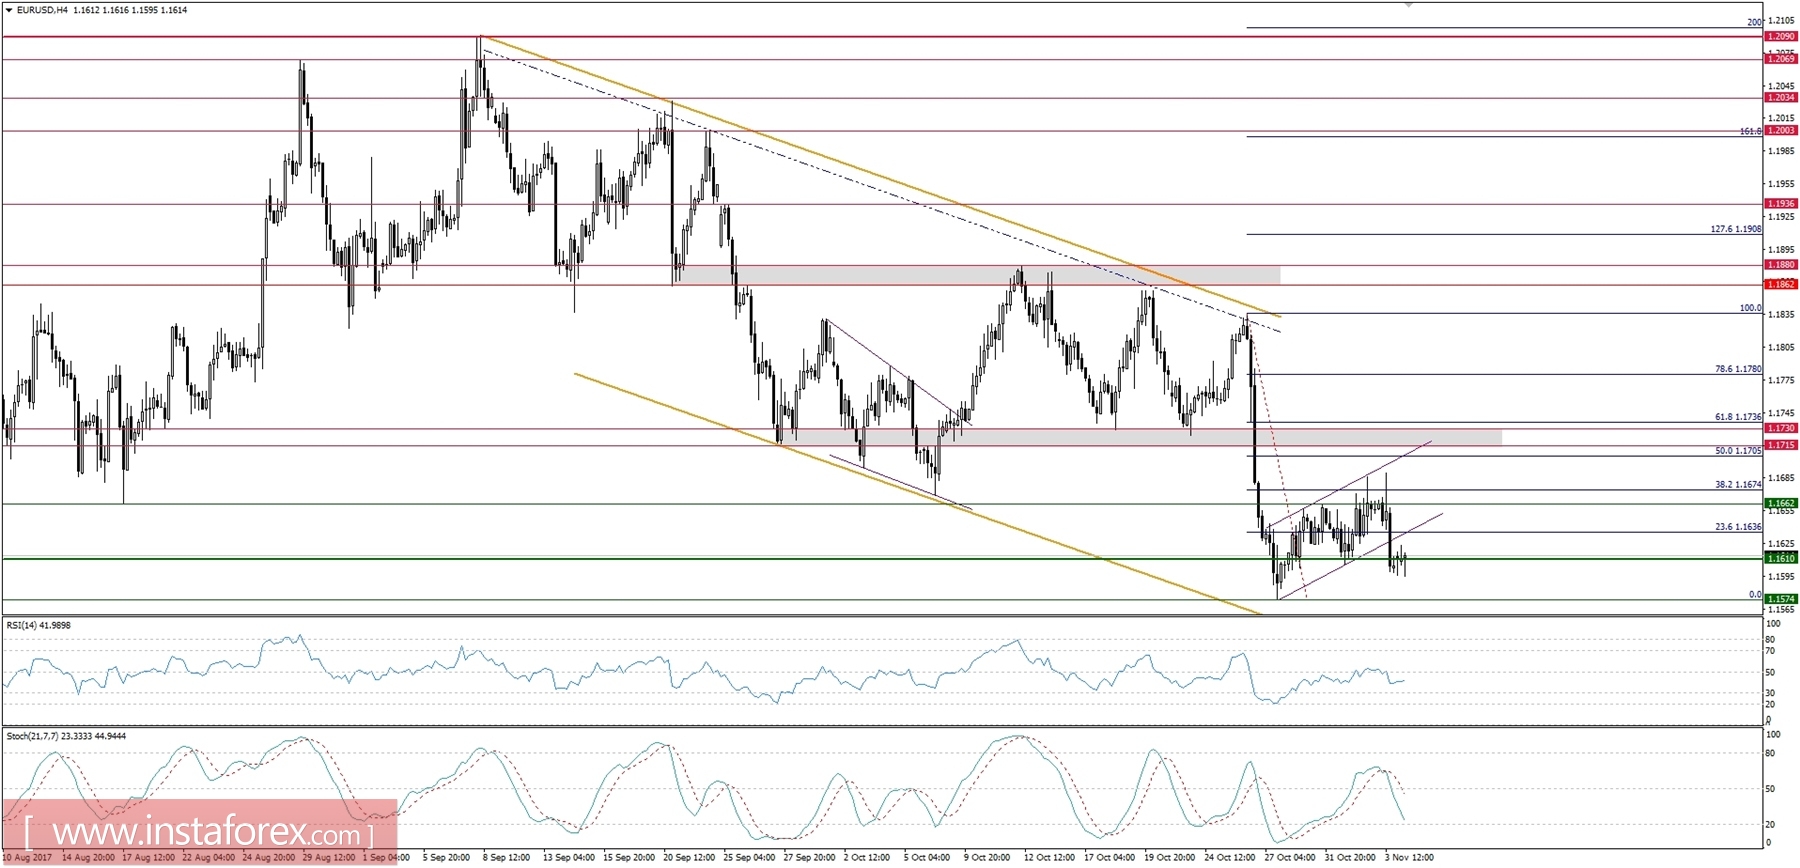
EUR/USD analysis for 06/11/2017:
The Eurozone PMI data are scheduled for release during the early stages of London session, between 07:00 am - 09:00 am GMT. Later on, the Eurozone will release the Sentix Investor Confidence data. This is a survey of about 2,800 investors and analysts which asks respondents to rate the relative 6-month economic outlook for the Eurozone. For this month there is an increase in sentiment expected, from 29.7 to 31.2 points, which would indicate that the overall mood across the Eurozone remains elevated.
Let's now take a look at the EUR/USD technical picture at the H4 time frame. The clear Bearish Flag pattern on the H4 time frame indicated another possible leg down in this pair. The bulls were unable to rally towards 50% Fibo at the level of 1.1705 and the momentum indicator is still oscillating around its fifty level. The outlook remains bearish and the sell-off might accelerate once the price breaks out below the 1.1575 support level.
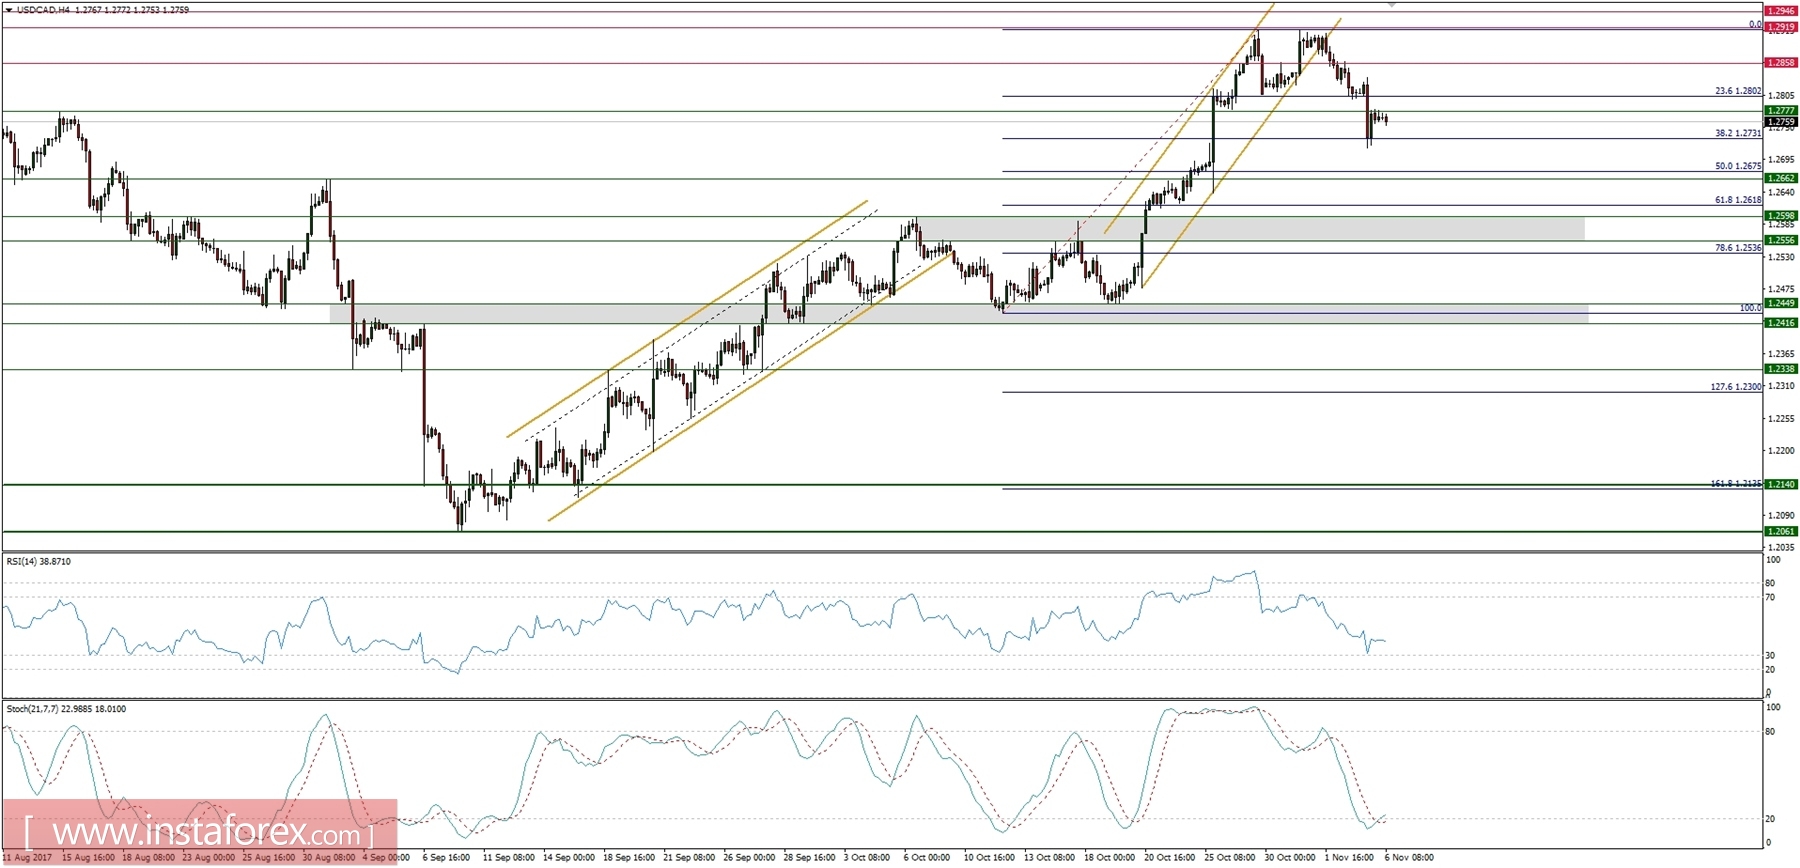
Market Snapshot: USD/CAD retraces 38%
The price of USD/CAD has retraced 38% of the precious swing up and bounced from the level of 1.2731. The next technical resistance is seen at the level of 1.2777. Market conditions are oversold, so a breakout above the resistance might lead towards the next technical level at 1.2802.
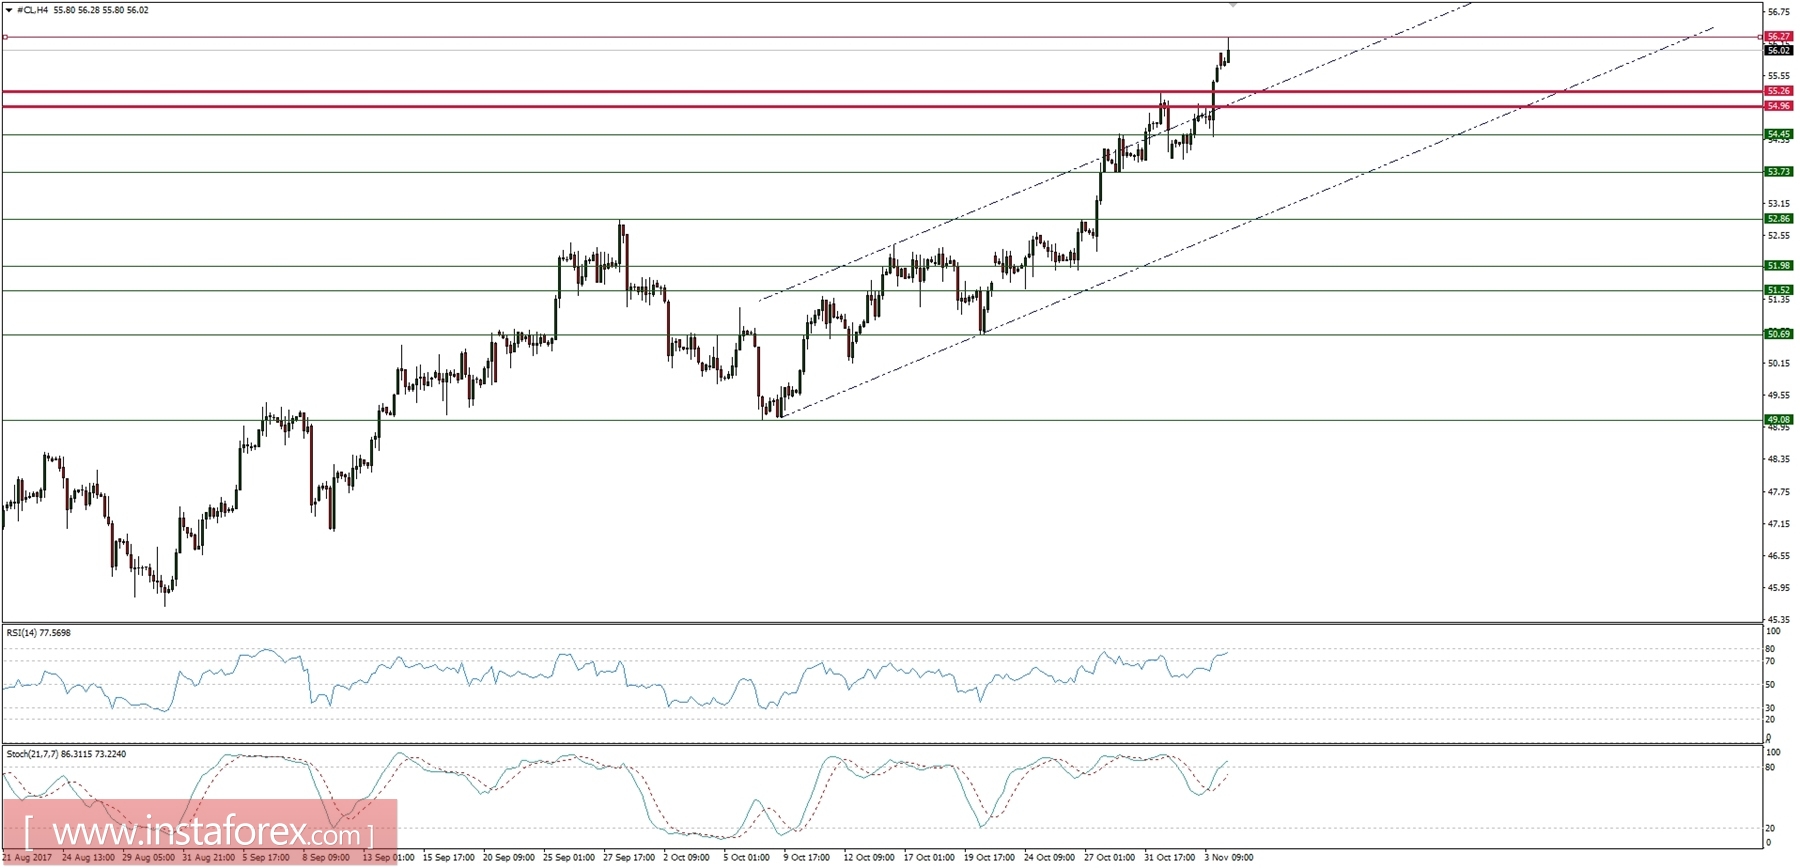
Market Snapshot: Crude Oil at new highs
The price of crude oil has made a new high at the level of $56.27 after tensions in Saudi Arabia escalated. Nevertheless, the move up is starting to look stretched as there is a visible bearish divergence between the price and the momentum oscillator. The most likely level to be tested in a case of a correction is the support at the level of $55.27.