English
  Русский
 Bahasa Indonesia
 Bahasa Malay
 ไทย
ไทย Español
 Deutsch
 Български
 Français
 Tiếng Việt
 中文
中文 বাংলা
বাংলা हिन्दी
 Čeština
 Українська
 Română

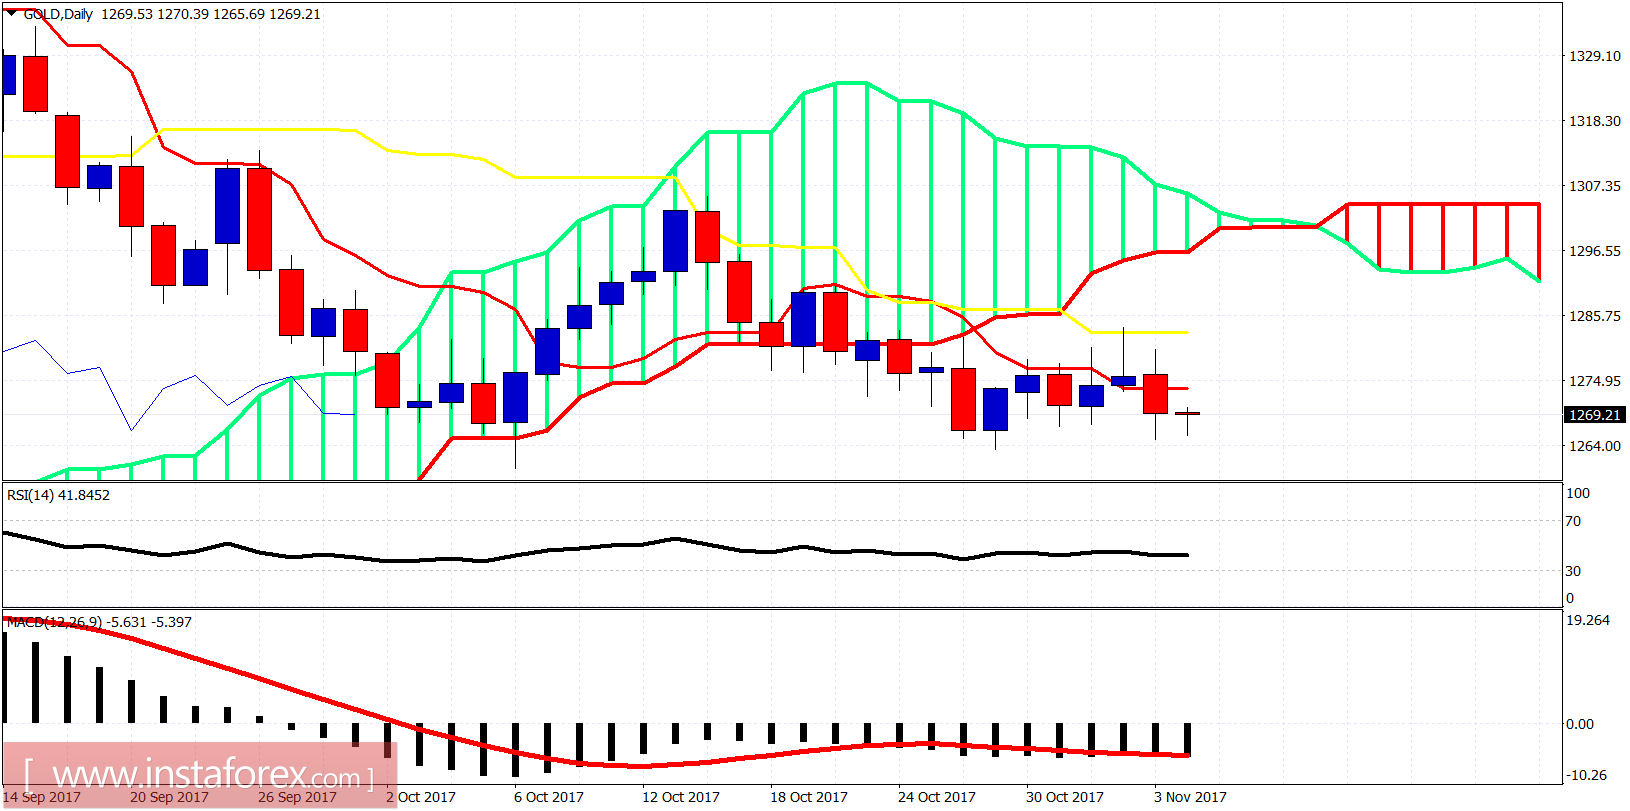
Gold price remains in a bearish trend. Price has broken again below the 4 hour Ichimoku cloud as it could not stay above $1,280 last week. Price got rejected at the important short-term resistance and that is why we closed near the lows.
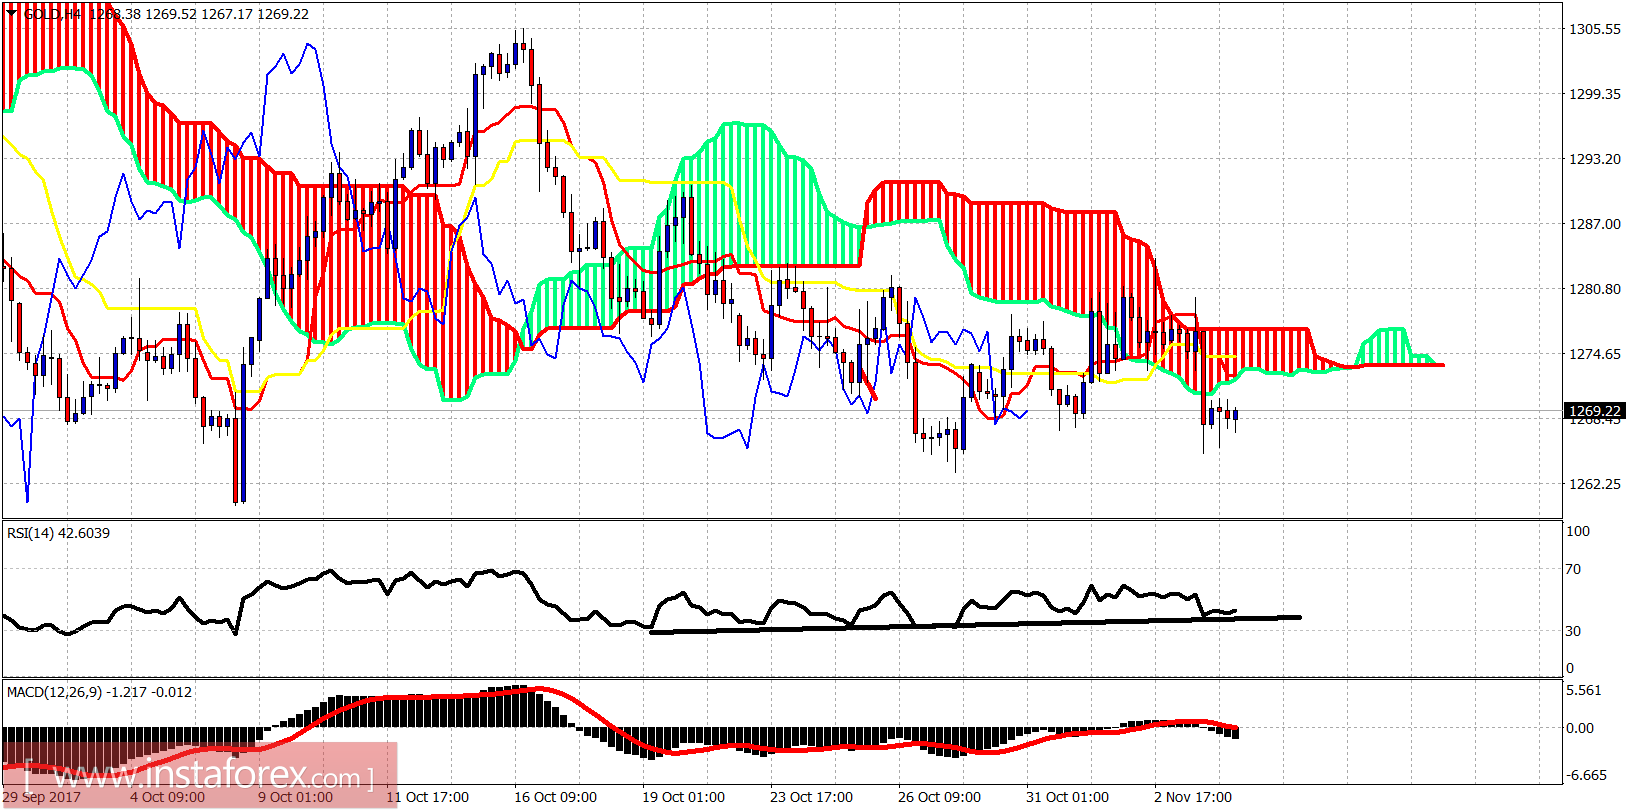
Gold price is trading below the 4 hour Kumo. The trend remains bearish. Price must break above $1,277 and close above it in order for the trend to change to bullish. Gold price continues to hold above the $1,262 low but there are increased chances of breaking below it towards $1,250-45. If the RSI support is broken, we should expect price to move towards $1,250, otherwise a bounce will come towards $1,277.