 English
  Русский
 Bahasa Indonesia
 Bahasa Malay
 ไทย
ไทย Español
 Deutsch
 Български
 Français
 Tiếng Việt
 中文
中文 বাংলা
বাংলা हिन्दी
 Čeština
 Українська
 Română

There are no major changes in the short-term structure for USDX, as it stays consolidated above the 200 SMA on the H1 chart. If the index manages to rebound over the moving average, it could be targeting the resistance zone of 95.85, while a pullback should make a lower extension to reach the 93.97 level.
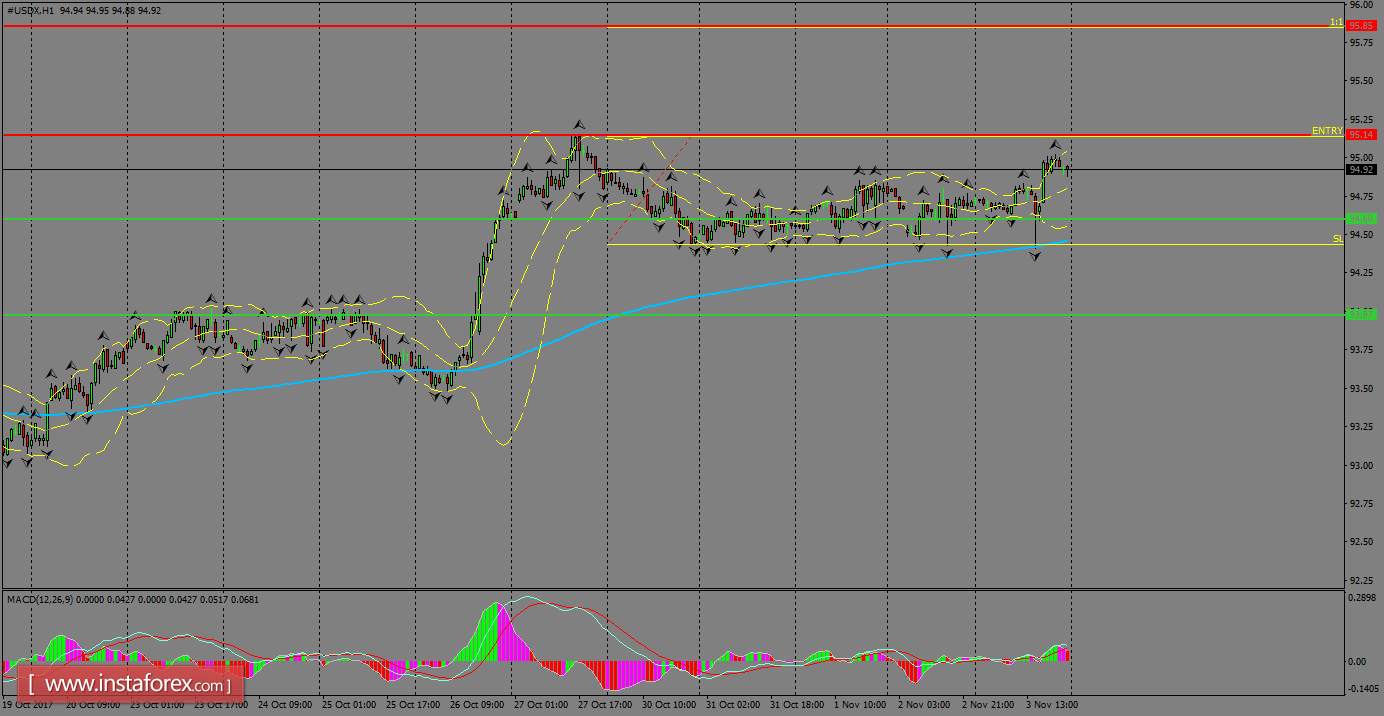
H1 chart's resistance levels: 95.14 / 95.85
H1 chart's support levels: 94.60 / 93.97
Trading recommendations for today: Based on the H1 chart, place buy (long) orders only if the USD Index breaks with a bullish candlestick; the resistance level is at 95.14, take profit is found at 95.85 and stop loss lies at 94.47.