 English
  Русский
 Bahasa Indonesia
 Bahasa Malay
 ไทย
ไทย Español
 Deutsch
 Български
 Français
 Tiếng Việt
 中文
中文 বাংলা
বাংলা हिन्दी
 Čeština
 Українська
 Română

GBP/USD is currently forming a bearish pattern on the H1 chart below the 200 SMA. The support level of 1.3037 is helping to give a short-lived boost to the pair across the board, but if it gives up, then we might expect another leg lower towards the 1.2880 level. To the upside, the nearest resistance lies at 1.3201.
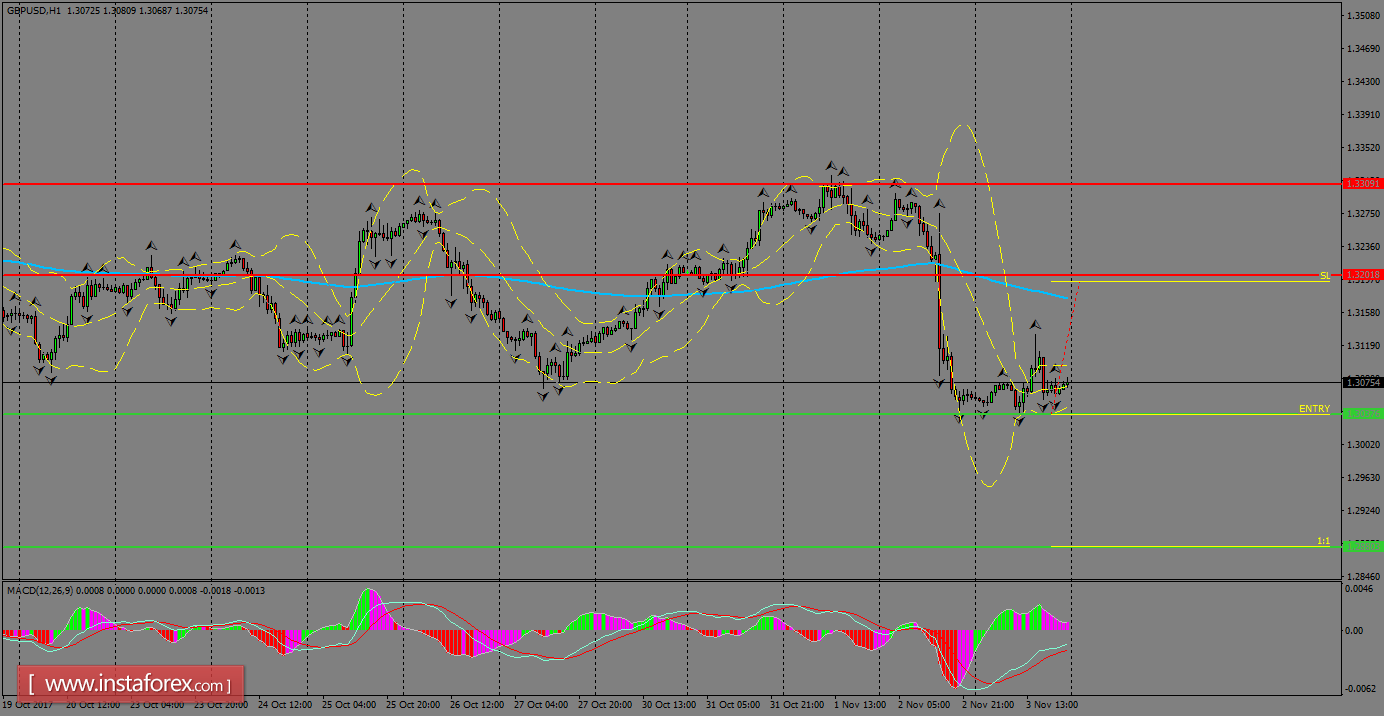
H1 chart's resistance levels: 1.3201 / 1.3309
H1 chart's support levels: 1.3037 / 1.2880
Trading recommendations for today: Based on the H1 chart, place sell (short) orders only if the GBP/USD pair breaks a bearish candlestick; the support level is at 1.3037, take profit lies at 1.2880 and stop loss is found at 1.3193.