 English
  Русский
 Bahasa Indonesia
 Bahasa Malay
 ไทย
ไทย Español
 Deutsch
 Български
 Français
 Tiếng Việt
 中文
中文 বাংলা
বাংলা हिन्दी
 Čeština
 Українська
 Română

The Gold price has entered the Kumo (cloud) and a short-term trend has changed to neutral, as the price is making very short-term higher highs and whenever it pulls back towards $1,270 buyers step in and push it back towards short-term resistance of $1,283.
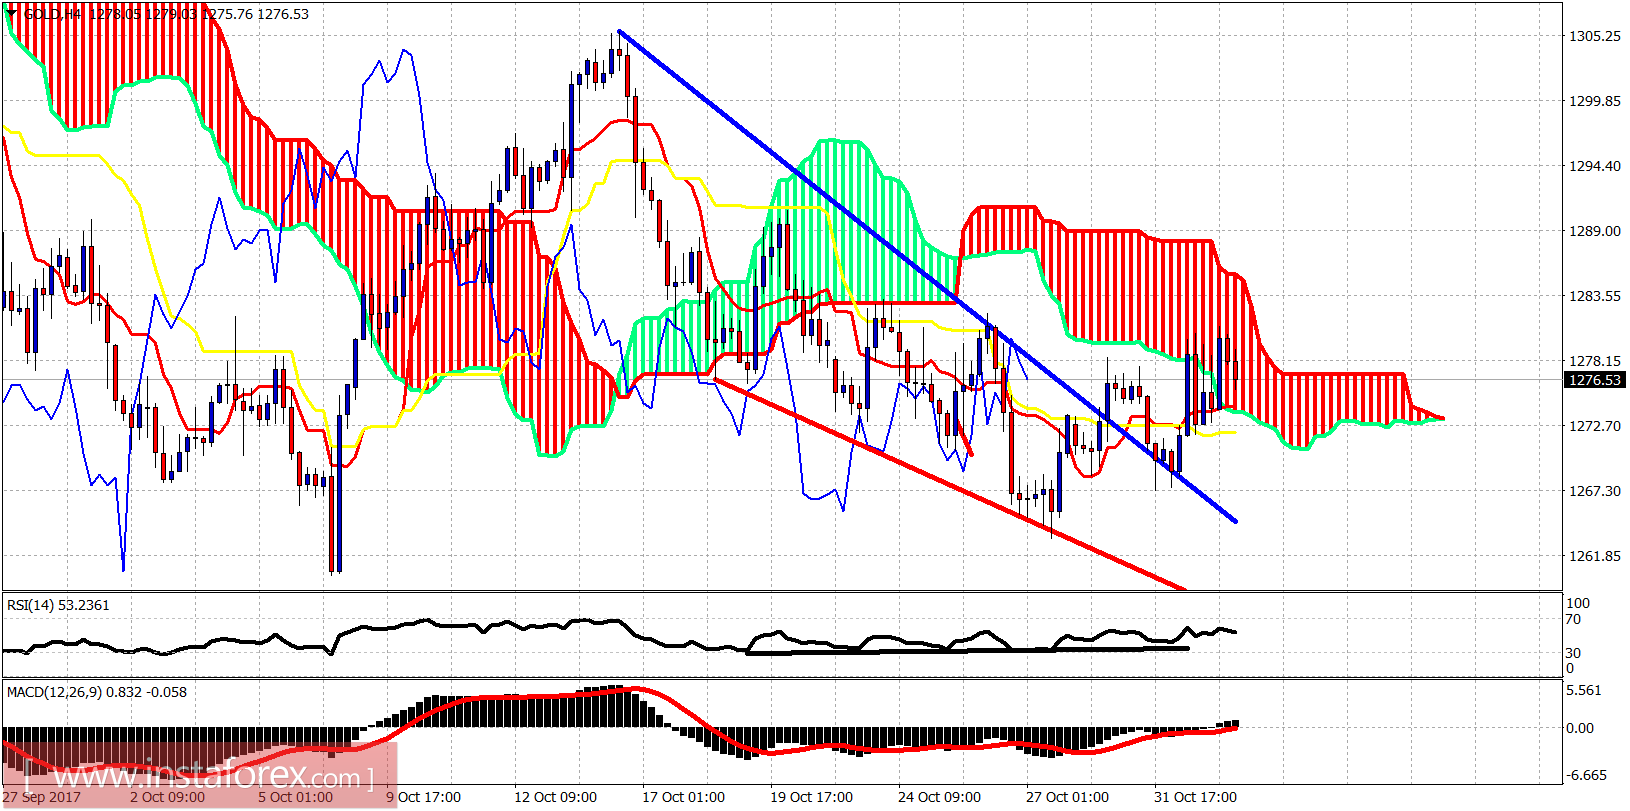
Red line - support
The Gold price has entered the Ichimoku cloud. The trend is now neutral. Support is at $1,267 and resistance remains at $1,283. Many stops are placed above $1,283 so a break above it will most probably push price towards $1,295-$1,300. This will be the first step towards the start of a new upward leg towards $1,400.
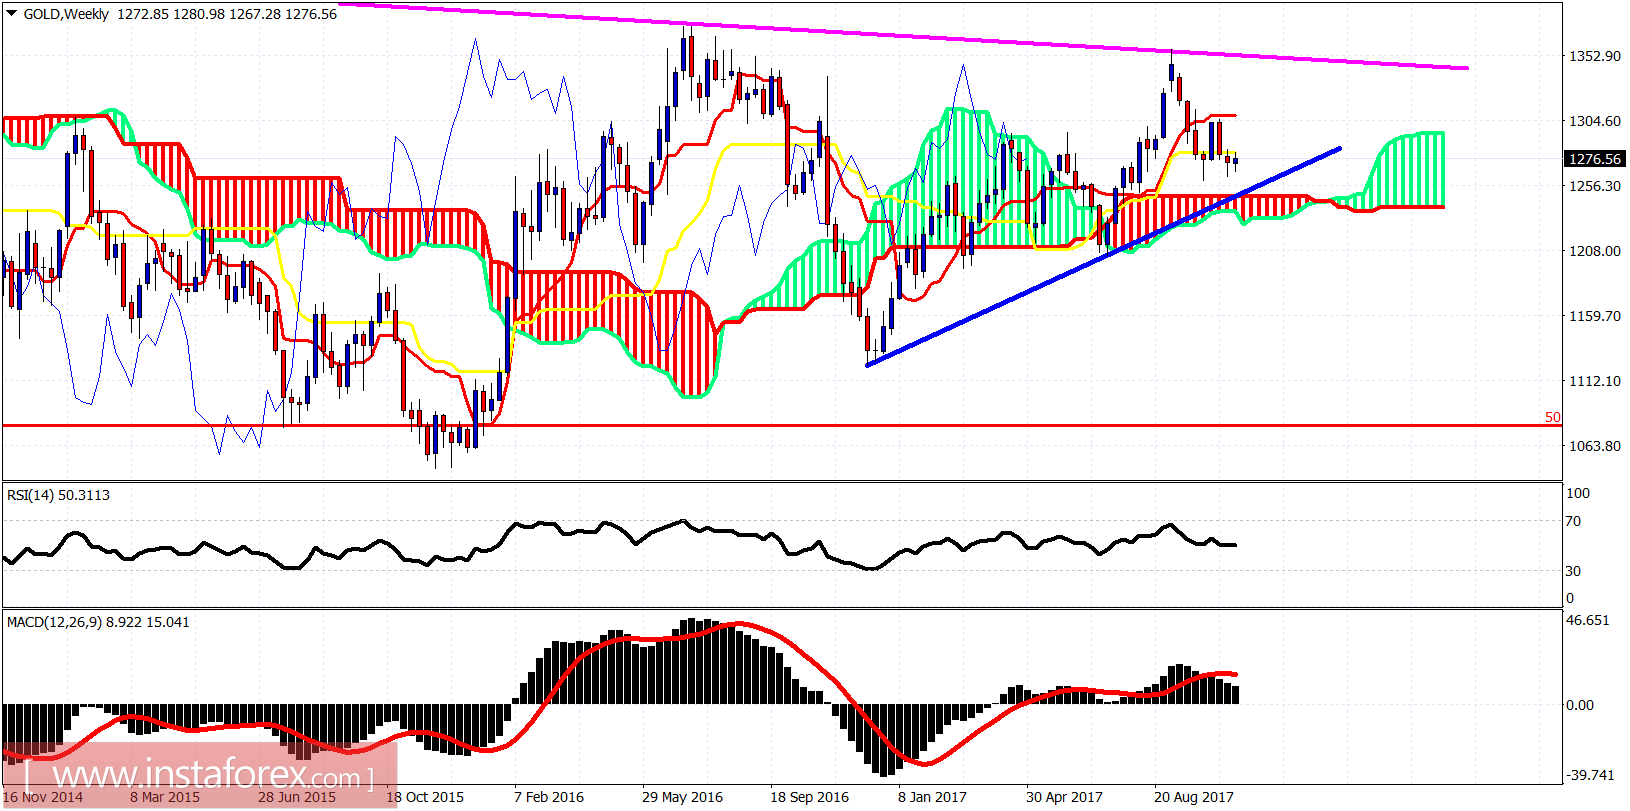
Magenta line -resistance
Gold weekly chart remains above the weekly Kumo. The trend is bullish. Gold could pull back towards $1,245-50 and the weekly Kumo but if price breaks above $1,307 we should expect a retest at the magenta trend line resistance.