 English
  Русский
 Bahasa Indonesia
 Bahasa Malay
 ไทย
ไทย Español
 Deutsch
 Български
 Français
 Tiếng Việt
 中文
中文 বাংলা
বাংলা हिन्दी
 Čeština
 Українська
 Română

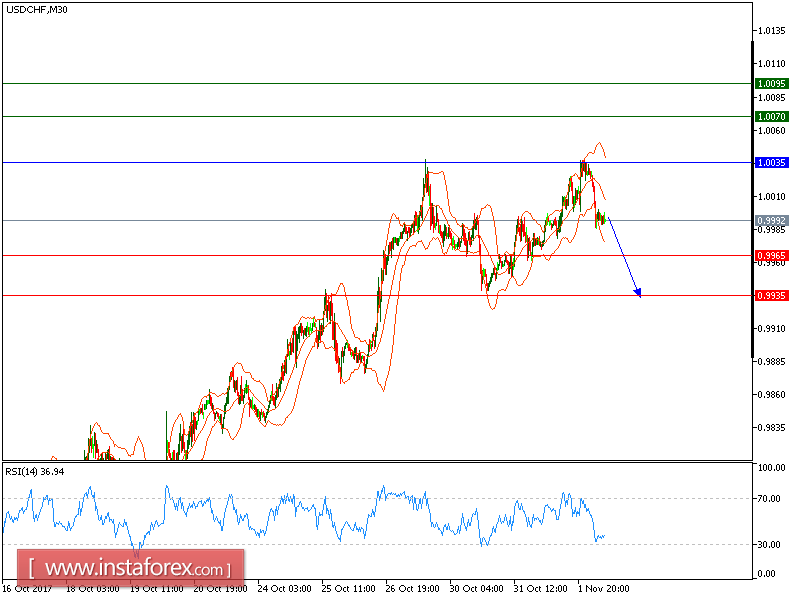
Our first target which we predicted in Yesterday's analysis has been hit. USD/CHF is expected to trade with a bearish bias. The pair retreated from 1.0035 (the high of November 1) and broke below its 20-period and 50-period moving averages. In addition, the bearish cross between 20-period and 50-period moving averages has been identified. The relative strength index is below its neutrality level at 50.
The U.S. Federal Reserve pointed out that the labor market has continued to strengthen and economic activity has been rising at a solid rate despite hurricane-related disruptions, hinting another rate rise would come before the year-end.
Meanwhile, Automatic Data Processing Inc (ADP) reported that private employers added 235,000 jobs in October, the most in seven months, compared with +110,000 jobs in September. The Institute for Supply Management (ISM) said its index of national factory activity slipped to 58.7 in October from 60.8 in September.
To conclude, below 1.0035, expect a new decline with targets at 0.9965 and 0.9935 in extension.
Chart Explanation: The black line shows the pivot point. The present price above the pivot point indicates a bullish position, and the price below the pivot points indicates a short position. The red lines show the support levels and the green line indicates the resistance levels. These levels can be used to enter and exit trades.
Strategy: SELL, Stop Loss: 1.0035, Take Profit: 0.9965
Resistance levels: 1.0070, 1.0095, and 1.0135
Support levels: 0.9965, 0.9935, and 0.9900