 English
  Русский
 Bahasa Indonesia
 Bahasa Malay
 ไทย
ไทย Español
 Deutsch
 Български
 Français
 Tiếng Việt
 中文
中文 বাংলা
বাংলা हिन्दी
 Čeština
 Українська
 Română

The price action in the GBP/USD pair remains in favor of the bulls temporarily, despite it has been trapped in a narrow range across the board. The resistance zone of 1.3309 is providing a solid barrier for the bulls and if it manages to pull back around that area, further declines are expected towards the 200 SMA on the H1 chart, around 1.3200.
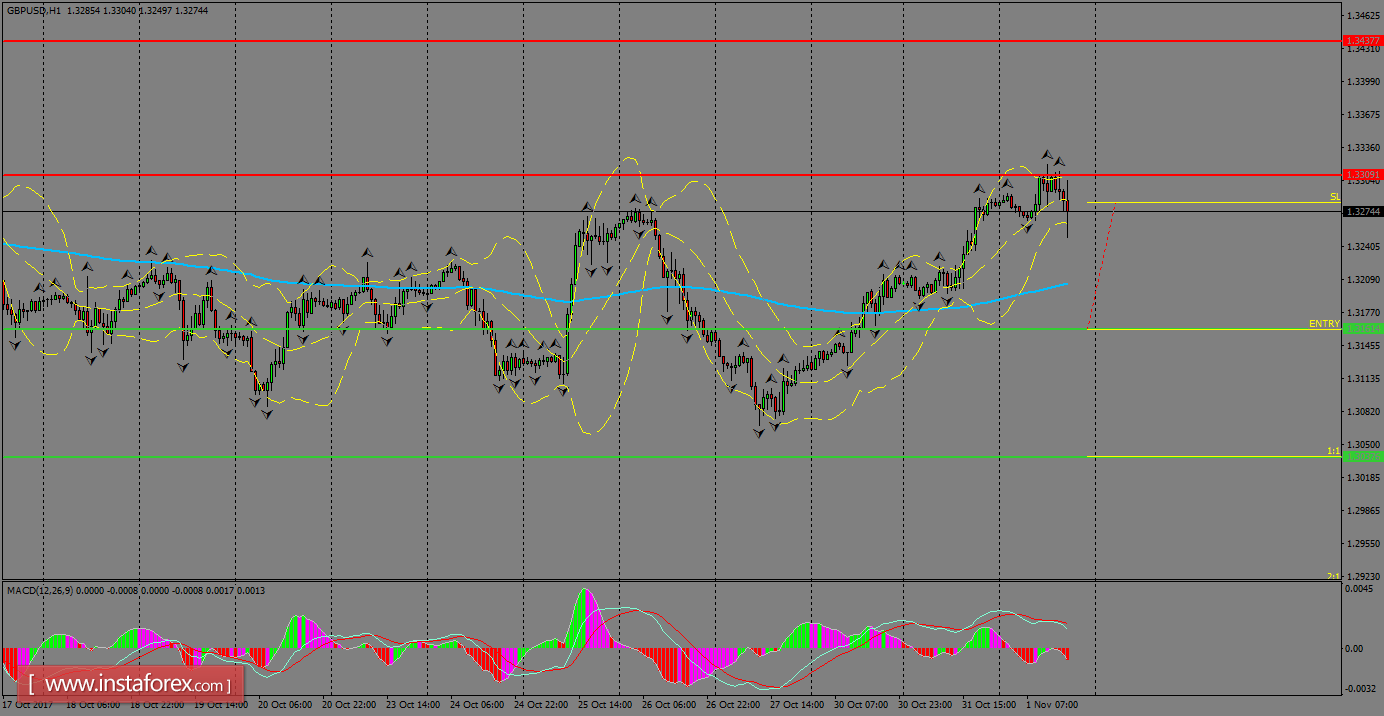
H1 chart's resistance levels: 1.3309 / 1.3437
H1 chart's support levels: 1.3161 / 1.3037
Trading recommendations for today: Based on the H1 chart, sell (short) orders only if the GBP/USD pair breaks a bearish candlestick; the support level is at 1.3161, take profit is at 1.3037 and stop loss is at 1.3282.