English
  Русский
 Bahasa Indonesia
 Bahasa Malay
 ไทย
ไทย Español
 Deutsch
 Български
 Français
 Tiếng Việt
 中文
中文 বাংলা
বাংলা हिन्दी
 Čeština
 Українська
 Română

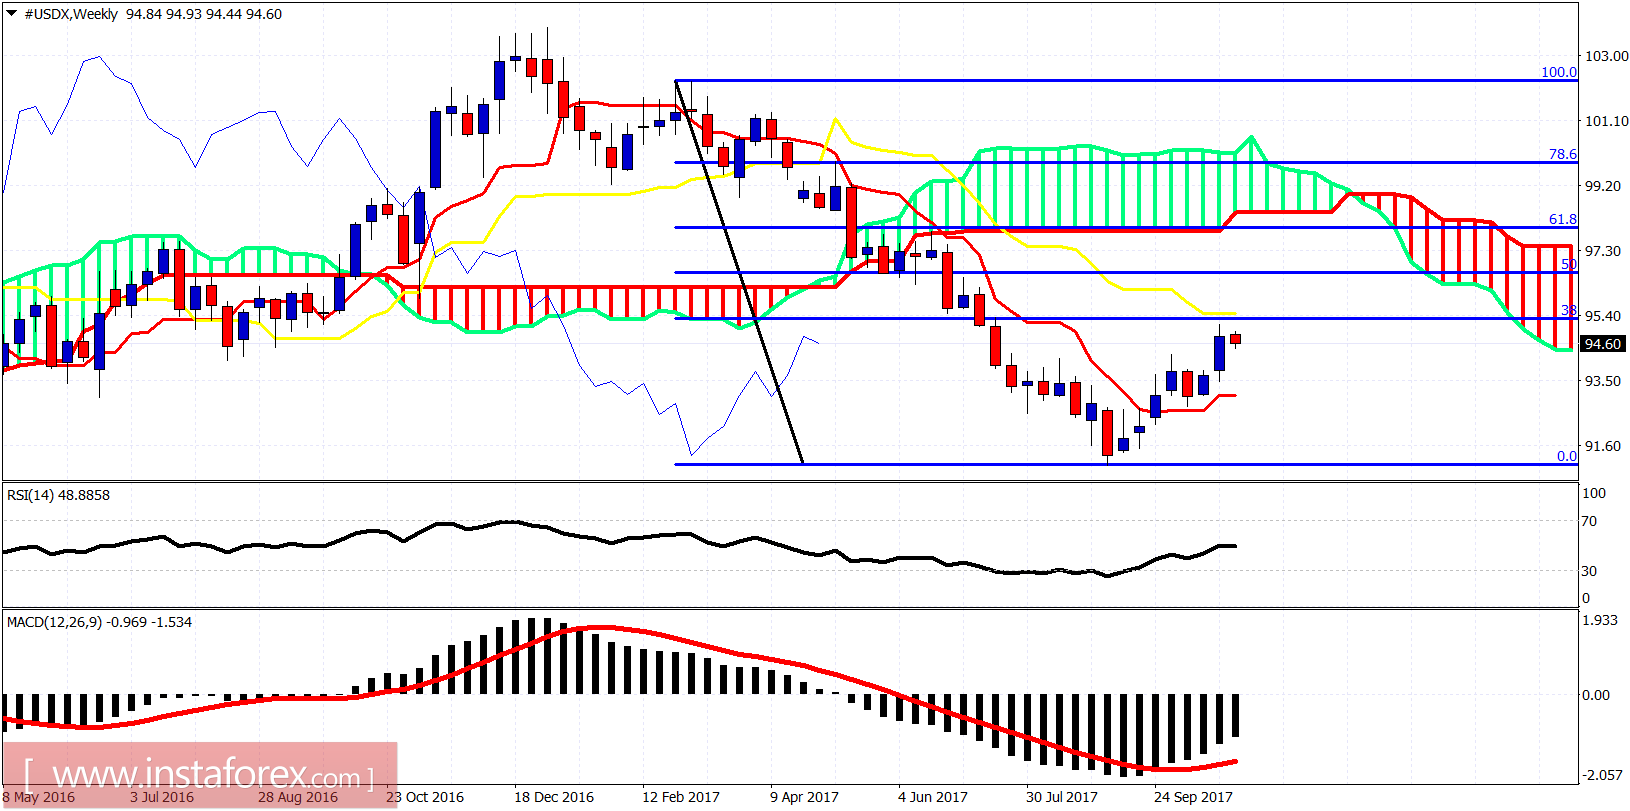
The Dollar index remains in a short-term bullish trend. The price is making higher highs and higher lows and remains inside the bullish short-term channel. The upside target remains at 95.50 as long as we trade above 93.50-94.
Blue lines - bullish channel
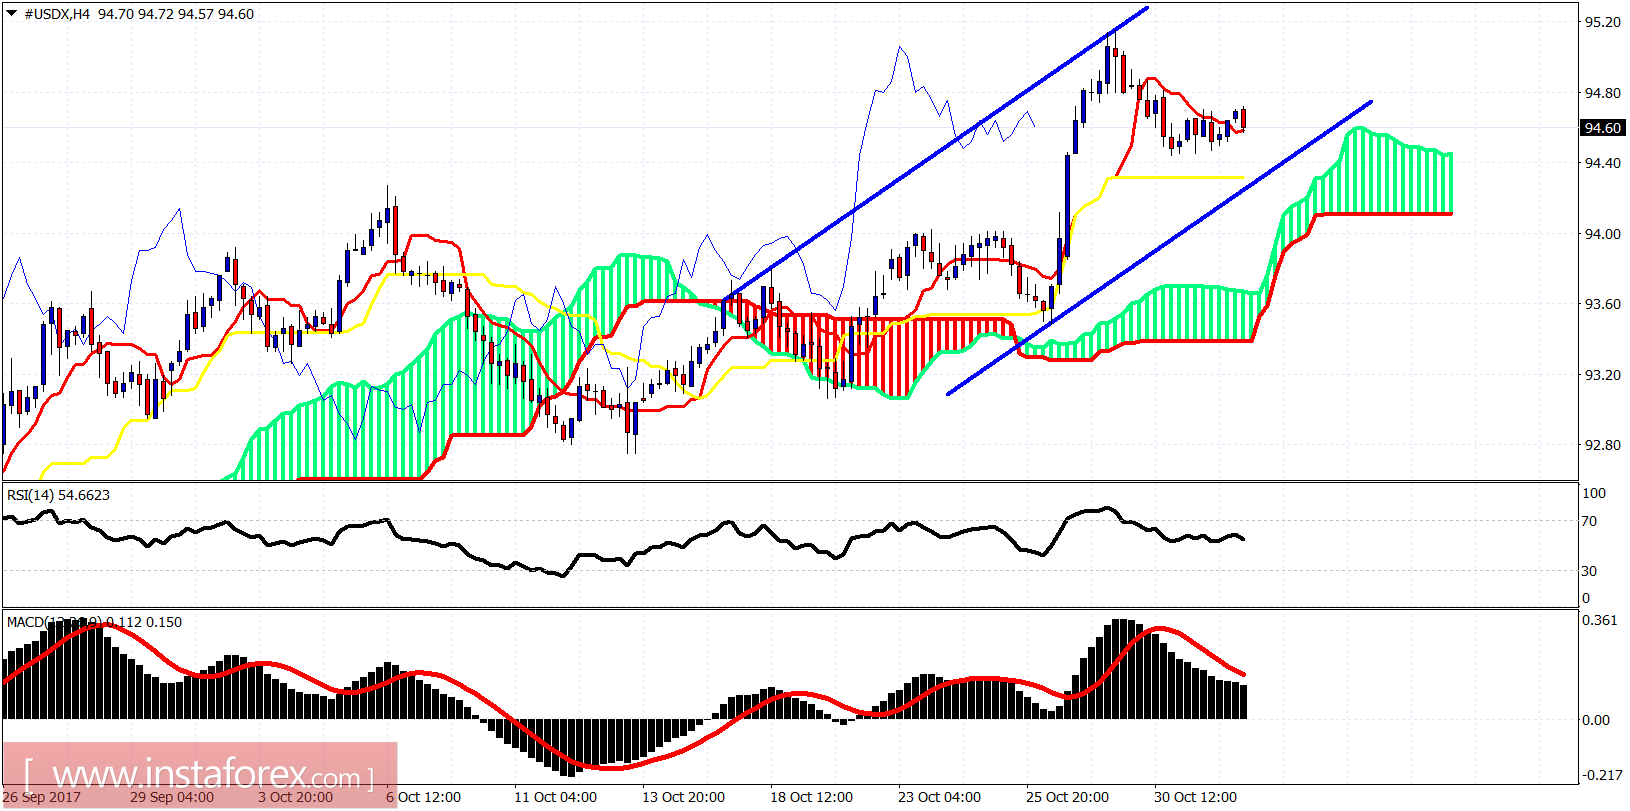
The 4-hour chart shows price above the important indicator kijun-sen (yellow line) and of course above the cloud. The trend is bullish. Support is at 94.40 and next at 94. We could test lower but for a move towards 95.50 to continue, support at 94 must not fail to hold.