English
  Русский
 Bahasa Indonesia
 Bahasa Malay
 ไทย
ไทย Español
 Deutsch
 Български
 Français
 Tiếng Việt
 中文
中文 বাংলা
বাংলা हिन्दी
 Čeština
 Українська
 Română

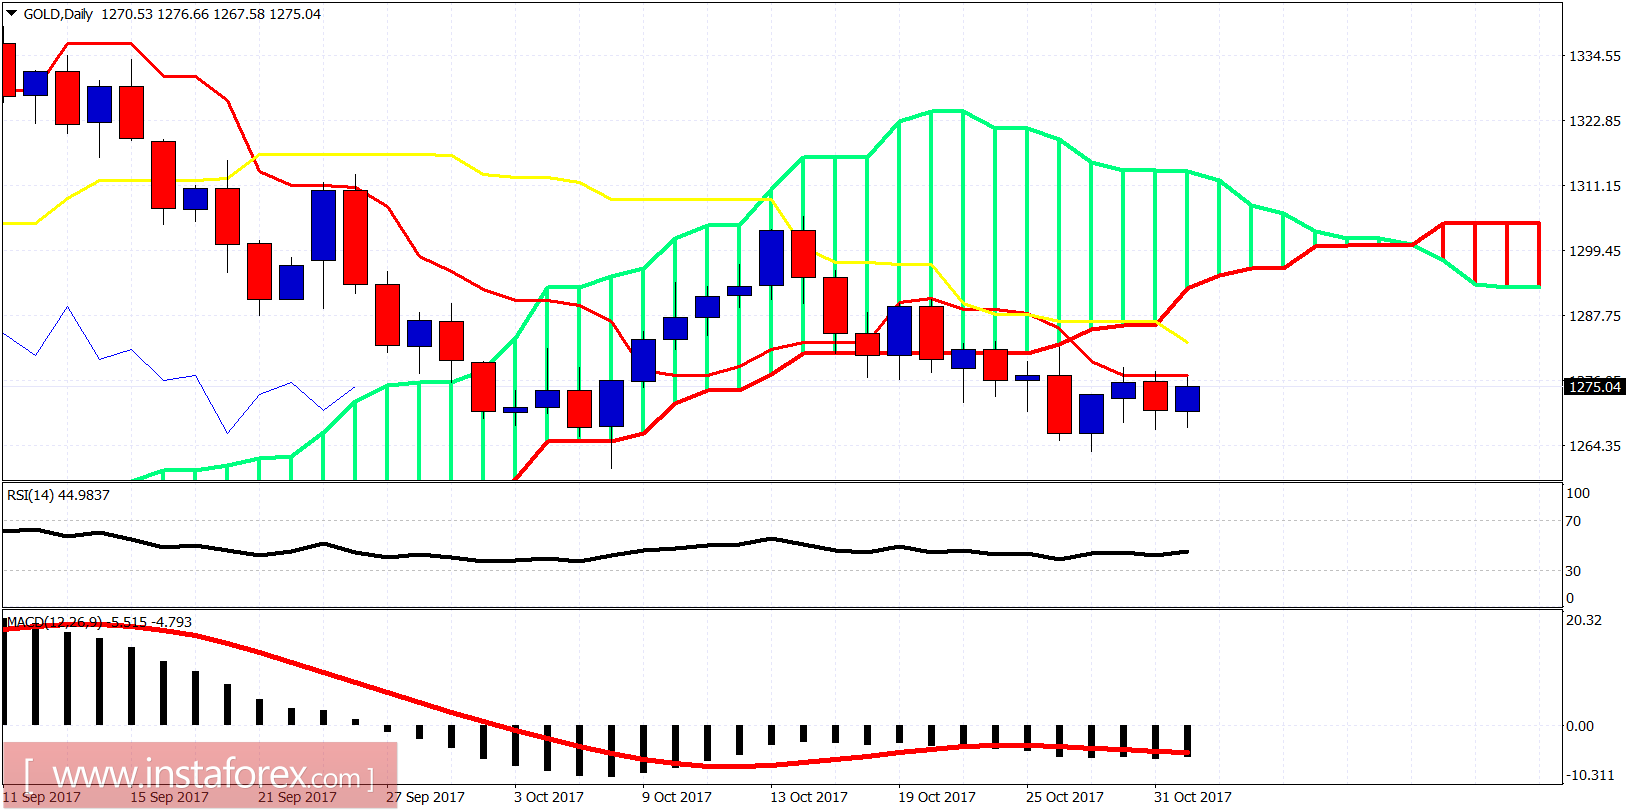
Gold has broken out of the downward sloping wedge pattern and yesterday it pulled back to back test the breakout area. Price made a higher low so far, but the short-term trend remains bearish as long as the price is below the Kumo.
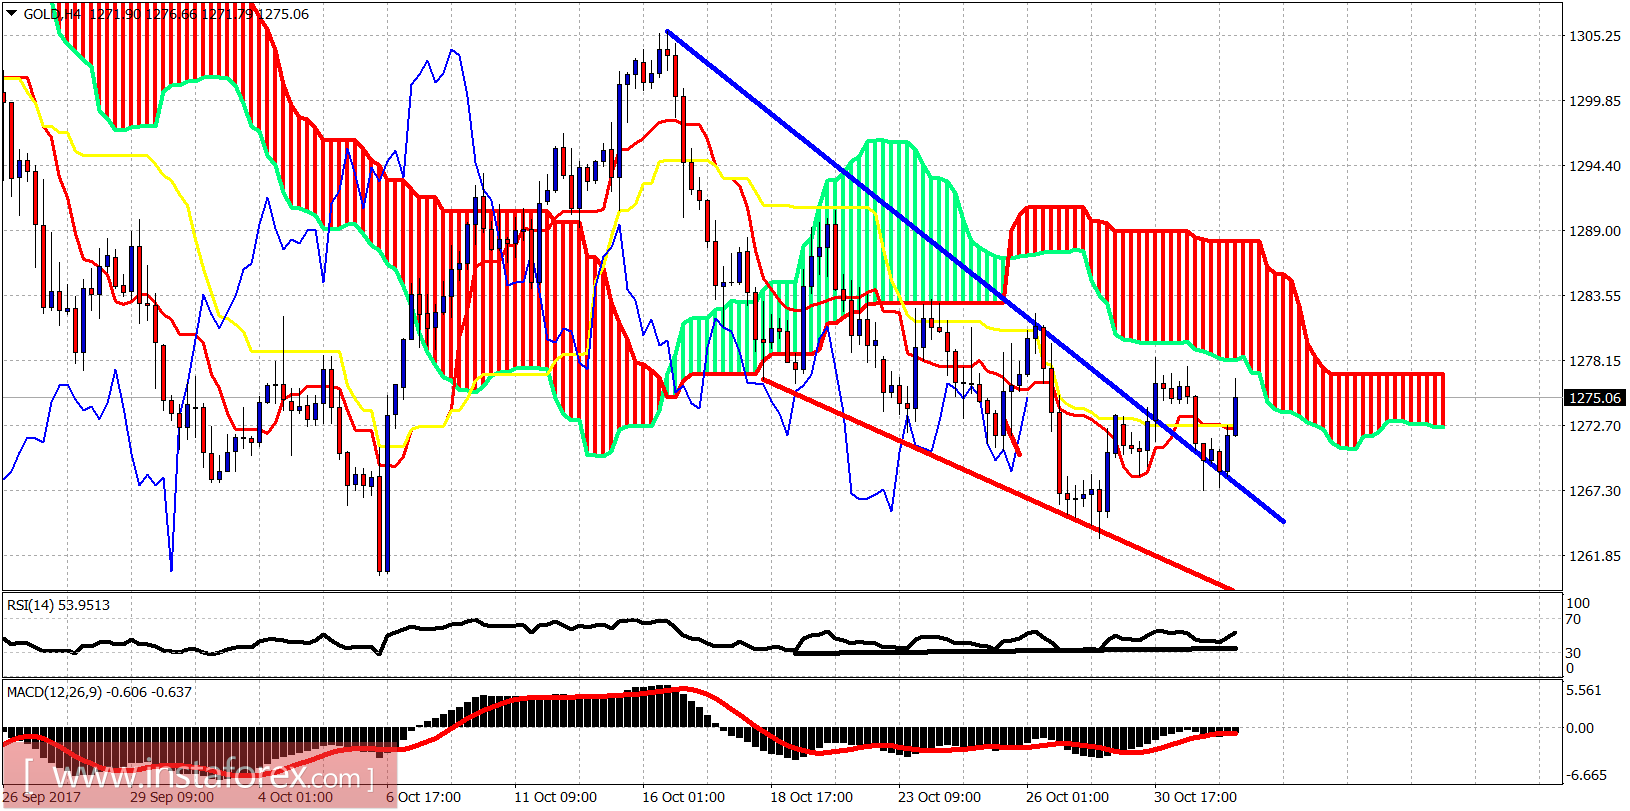
Red line - support
The Gold price is trading below the 4 hour Kumo (cloud) resistance. This resistance is at $1,279-83. Support is at $1,267. Breaking below support will open the way for a move lower towards $1,260 or even lower.