 English
  Русский
 Bahasa Indonesia
 Bahasa Malay
 ไทย
ไทย Español
 Deutsch
 Български
 Français
 Tiếng Việt
 中文
中文 বাংলা
বাংলা हिन्दी
 Čeština
 Українська
 Română

The pair once again is setting the bullish tone above the 200 SMA at H1 chart and remains trapped in a range across the board. According to our short-term projections, we're expecting that GBP/USD reaches the resistance zone of 1.3309, at which could be offered to re-test the moving average mentioned above. If it manages to break such area, a leg lower towards the 1.3037 level is expected.
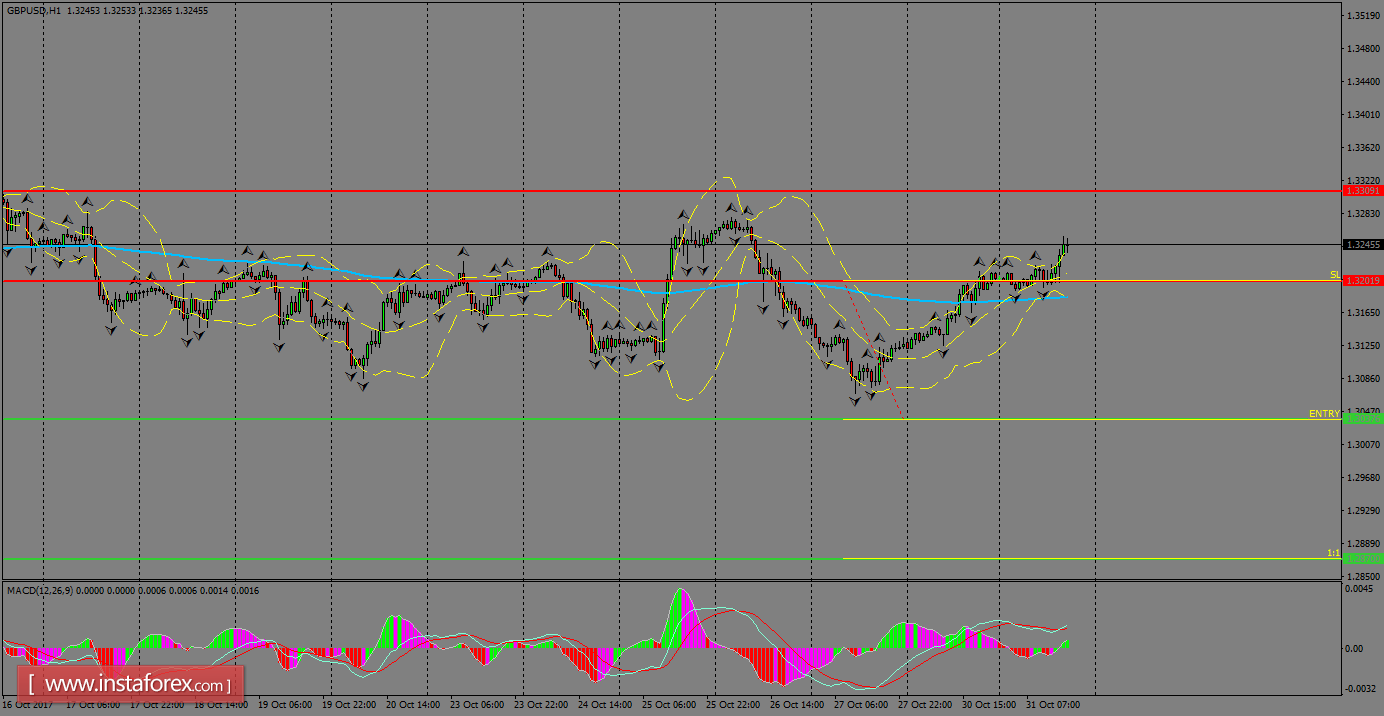
H1 chart's resistance levels: 1.3201 / 1.3309
H1 chart's support levels: 1.3037 / 1.2870
Trading recommendations for today: Based on the H1 chart, sell (short) orders only if the GBP/USD pair breaks a bearish candlestick; the support level is at 1.3037, take profit is at 1.2870 and stop loss is at 1.3201.