 English
  Русский
 Bahasa Indonesia
 Bahasa Malay
 ไทย
ไทย Español
 Deutsch
 Български
 Français
 Tiếng Việt
 中文
中文 বাংলা
বাংলা हिन्दी
 Čeština
 Українська
 Română

We will retain our yesterday's prediction on the pair. GBP/JPY is still expected to trade with bullish outlook. The pair is trading above its rising 20-period and 50-period moving averages, which play support roles and maintain the bullish bias. The relative strength index is bullish and calls for a further advance. The downside potential should be limited by the key support at 149.10.
Hence, as long as this key level is not broken, look for a new challenge with targets at 150.40 and 150.90 in extension.
Alternatively, if the price moves in the direction opposite to the forecast, a short position is recommended below 149.10 with the target at 148.60.
Strategy: BUY, Stop Loss: 149.10, Take Profit: 150.40
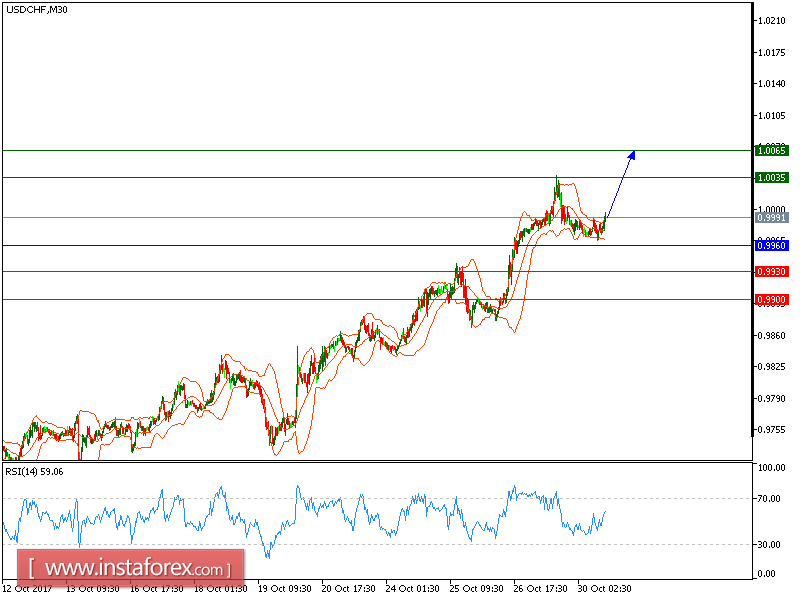
Chart Explanation: the black line shows the pivot point. The price above the pivot point indicates long positions; and when it is below the pivot points, it indicates short positions. The red lines show the support levels and the green line indicates the resistance levels. These levels can be used to enter and exit trades.
Resistance levels: 150.40, 150.90 and 151.45
Support levels: 148.60, 147.90, and 147.35