The US dollar index has pulled back towards the 38% Fibonacci retracement of the latest rise from 93.50. The decline looks corrective and it is more probable to see new highs in the index. The level of 95.45 remains our bounce target but not to be traded as I prefer to wait for a selling opportunity or signal.
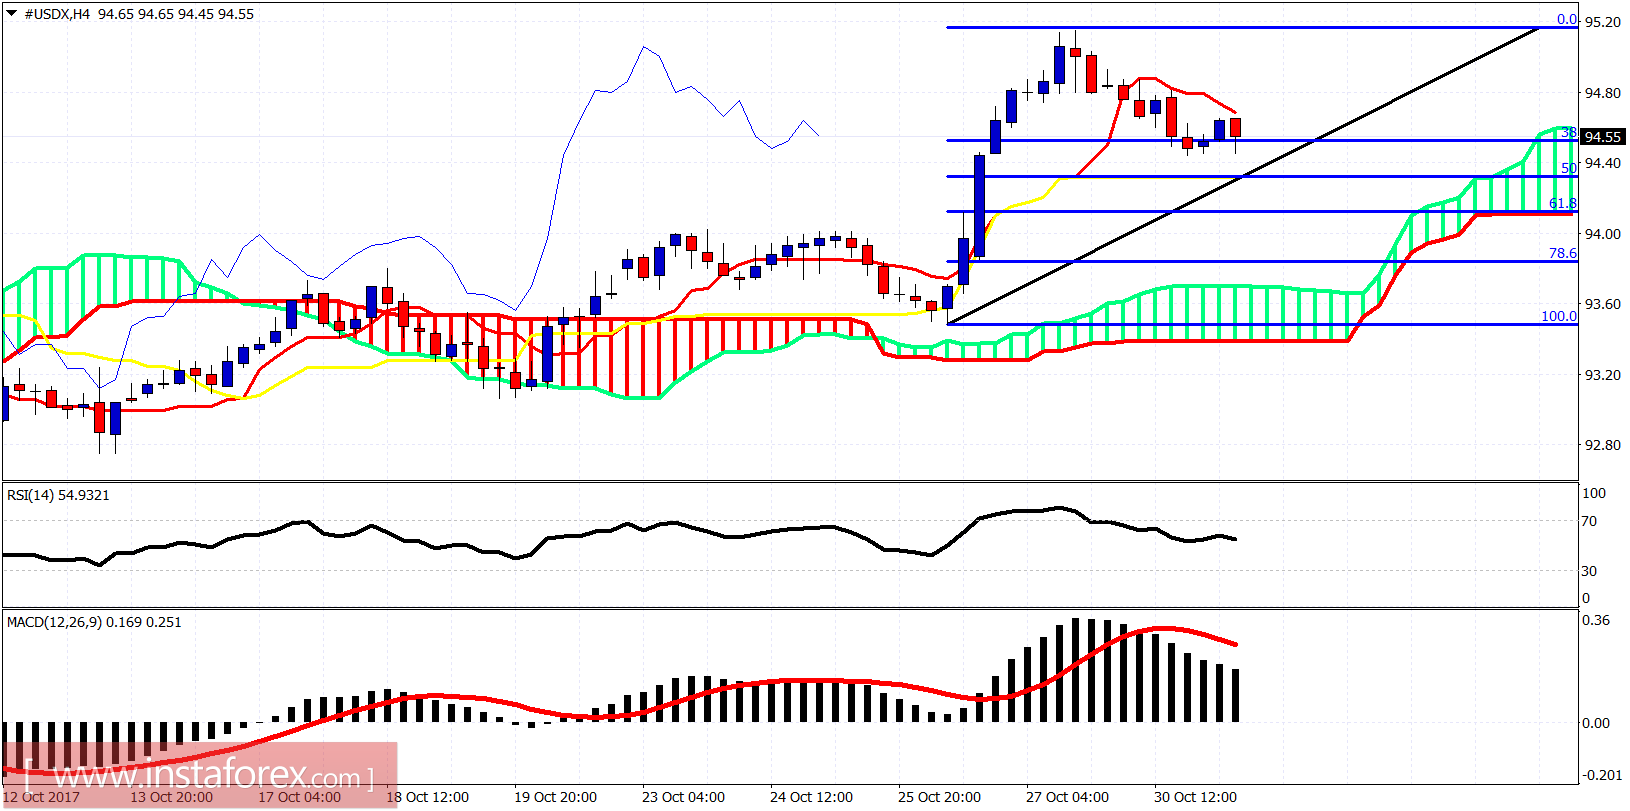
The dollar index is trading above the 4 hour Kumo cloud support. Price is hovering between the Tenkan- and the Kijun-sen indicators. Support by the Kijun-sen is at 94.30 while resistance lies at 94.70. The trend remains bullish and this is still considered as a pull back in an up-trend.
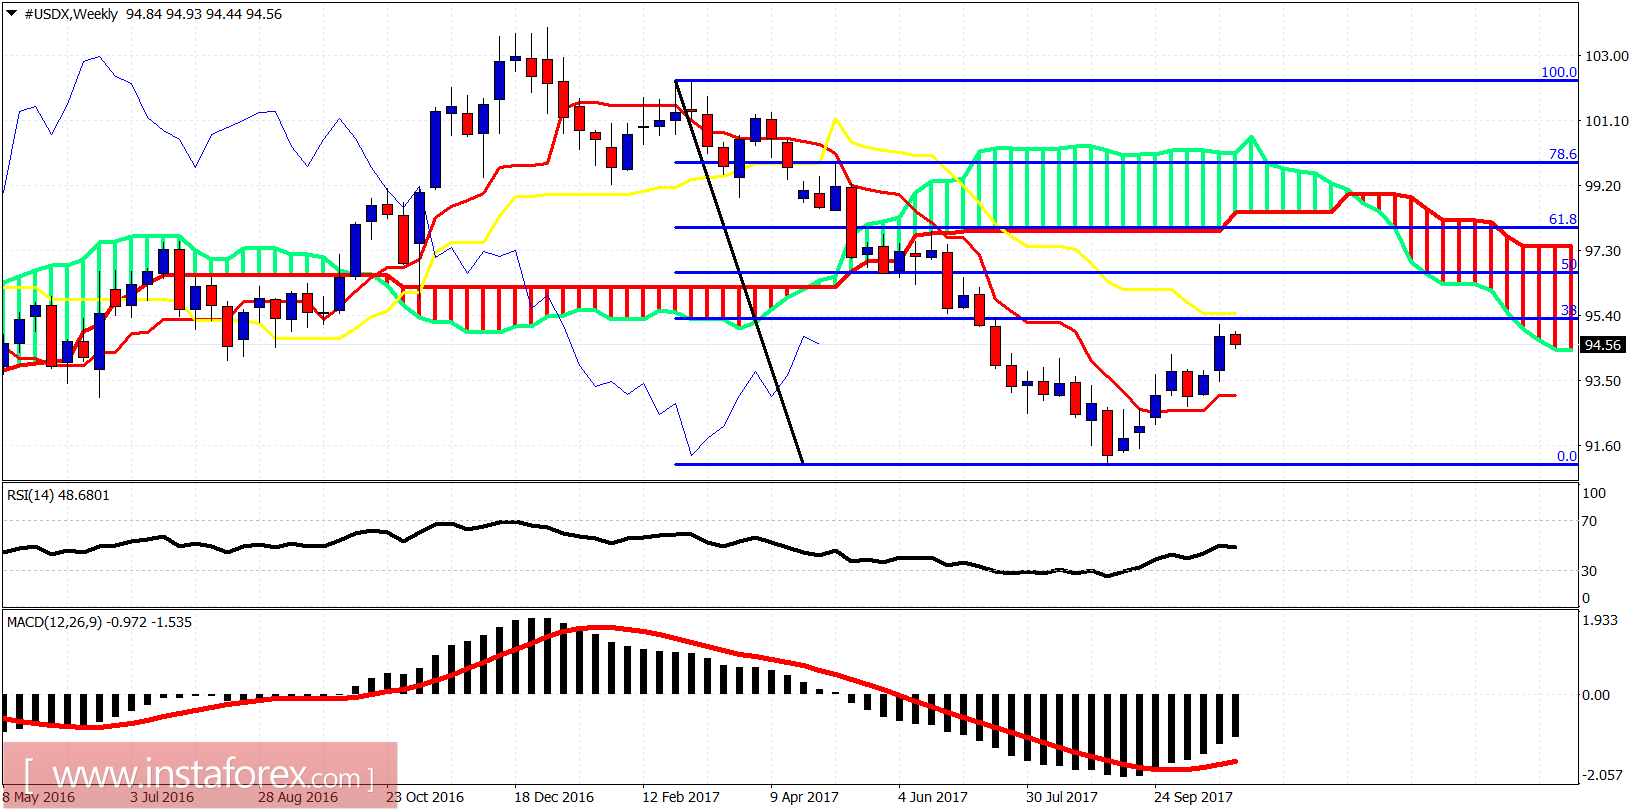
On a weekly basis the price is making higher highs and higher lows. It is approaching our short-term target of the 38% Fibonacci retracement. Above 94 is not the time to be buying the dollar index. I prefer to wait for a sell signal and an opportunity around 95.50 because I expect a rejection and a reversal in the index.
*The market analysis posted here is meant to increase your awareness, but not to give instructions to make a trade
 English
  Русский
 Bahasa Indonesia
 Bahasa Malay
 ไทย
ไทย Español
 Deutsch
 Български
 Français
 Tiếng Việt
 中文
中文 বাংলা
বাংলা हिन्दी
 Čeština
 Українська
 Română
