 English
  Русский
 Bahasa Indonesia
 Bahasa Malay
 ไทย
ไทย Español
 Deutsch
 Български
 Français
 Tiếng Việt
 中文
中文 বাংলা
বাংলা हिन्दी
 Čeština
 Українська
 Română

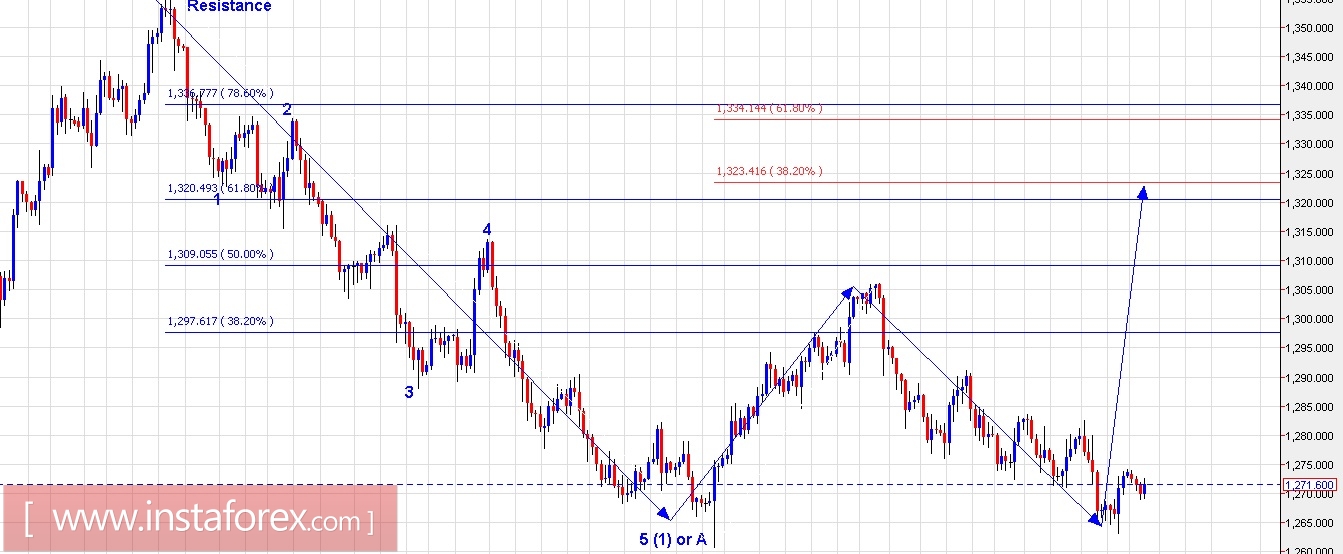
Technical outlook:
The yellow metal seems to have dropped into 5 waves from $1,357.00 levels as labeled here until October 06, 2017. An impulse normally leads to a 3 wave correction and the rally between $1,260 through $1,306 seems to be the first corrective wave. The drop from $1,306 towards $1263 lows made on Friday last can be considered as the second corrective wave. If the wave counts till now holds to be true, the most probable push from here should be on the north side towards $1,320 levels going forward. Also, prices should broadly remain above $1260.50 levels for this count to be true. In conventional terms, the current setup is called a down Gartley if prices manage to reach $1,320 levels from here. Resistance should remain strong near $1,357 levels and the pull back rally should be well capped below $1,357 going forward.
Trading plan:
Aggressive traders would remain long with risk below $1260 targeting $1,320, while conservative traders would remain flat for now and look to sell higher.
Silver chart setups:
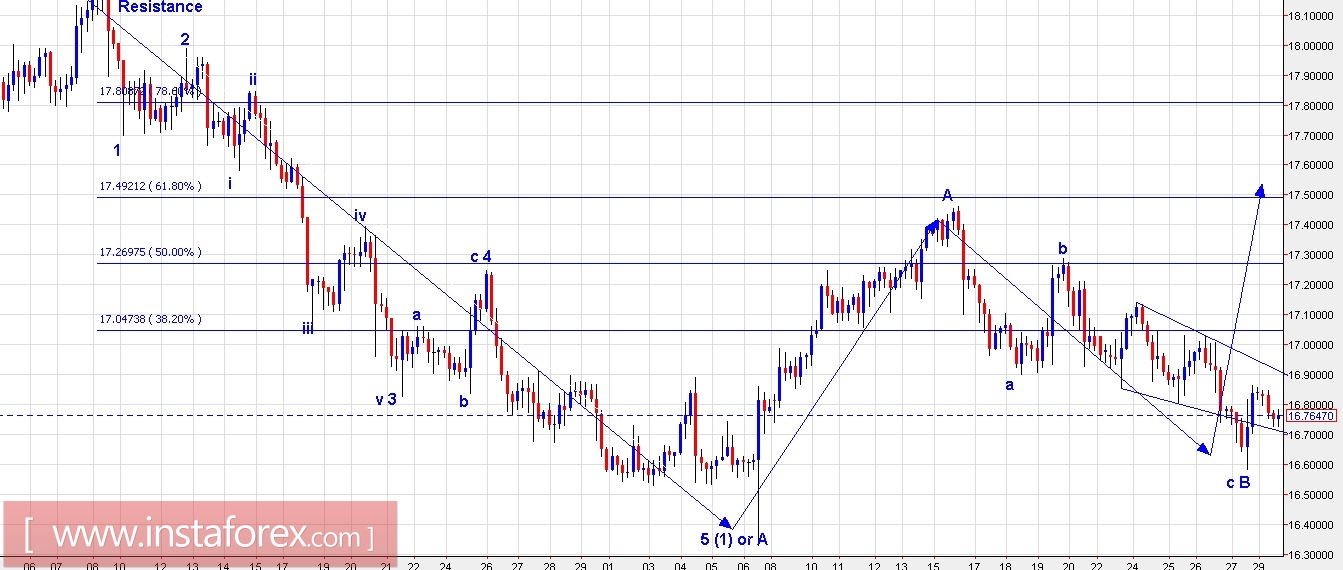
Technical Outlook:
Silver wave counts are pretty clear and similar to that of the yellow metal. It dropped in a clear impulse from $18.20 through $16.30 levels earlier as labeled here. The lows made on October 06, 2017 is labelled as wave (1) or A. Furthermore, the rally through $17.45 levels can be defined as wave A of the corrective A-B-C, while the subsequent drop towards $16.60 levels (last Friday), can be defined as wave B. If the above wave counts hold to be true, the most probable push should be on the north side defined as wave C towards $17.60/80 levels. Resistance is at $18.20 levels and prices should remain well capped below the same for any counter-trend rallies ahead. An interim support is at $16.30 levels and hence prices should ideally remain above that to keep the above wave structure intact. Also, note that the Fibonacci resistance will be strong at $17.60 levels to keep rallies under check.
Trading plan:
Aggressive traders should remain long now with risk below $16.30 levels, targeting $17.60/80, while conservative traders should remain flat, looking to sell higher.
Fundamental outlook:
Please watch out for USD PCE Core and German Consumer Price Index between 0830 and 0900 AM EST today.
Good luck!