English
  Русский
 Bahasa Indonesia
 Bahasa Malay
 ไทย
ไทย Español
 Deutsch
 Български
 Français
 Tiếng Việt
 中文
中文 বাংলা
বাংলা हिन्दी
 Čeština
 Українська
 Română

The beginning of the week brings a calm start, but it should not be boring with BoJ, Fed, BoE and NFP reports, and events in Spain. USD is kept in the middle of the rate with limited fluctuations in exchange rates. Only NZD loses more weight under its own weight.The stock market is flat. The Nikkei 225 remains at Friday's closing level, consolidating earlier gains to the 21-year highs. Hang Seng loses 0.1$.
On Monday 30th of October, the event calendar is light with important news releases, but the market participants will keep an eye on Retail Sales and Preliminary CPI data from Germany, KOF Economic Barometer data form Switzerland, Net Lending to Individuals data from the UK and Personal Spending data from the US.
EUR/USD analysis for 30/10/2017:
The German Retail Sales data were released in line with the expectations at the level of 0.5% on monthly basis and recorded a quarterly increase to 4.1% from 3.0%. The question remains whether the preliminary CPI data will meet the market participants expectations of 0.1% increase as well, but traders will find out later today.
On the other news that might influence EUR/USD rate today: Jerome Powell, a relatively dovish board member of the Fed, is a favorite in the race for the Fed chairman's chair. The above reports contribute to minimizing the probability of choosing the highly hawkish John Taylor, the creator of the quantitative instrumental method, through which respect for the optimal cost of money is evaluated.
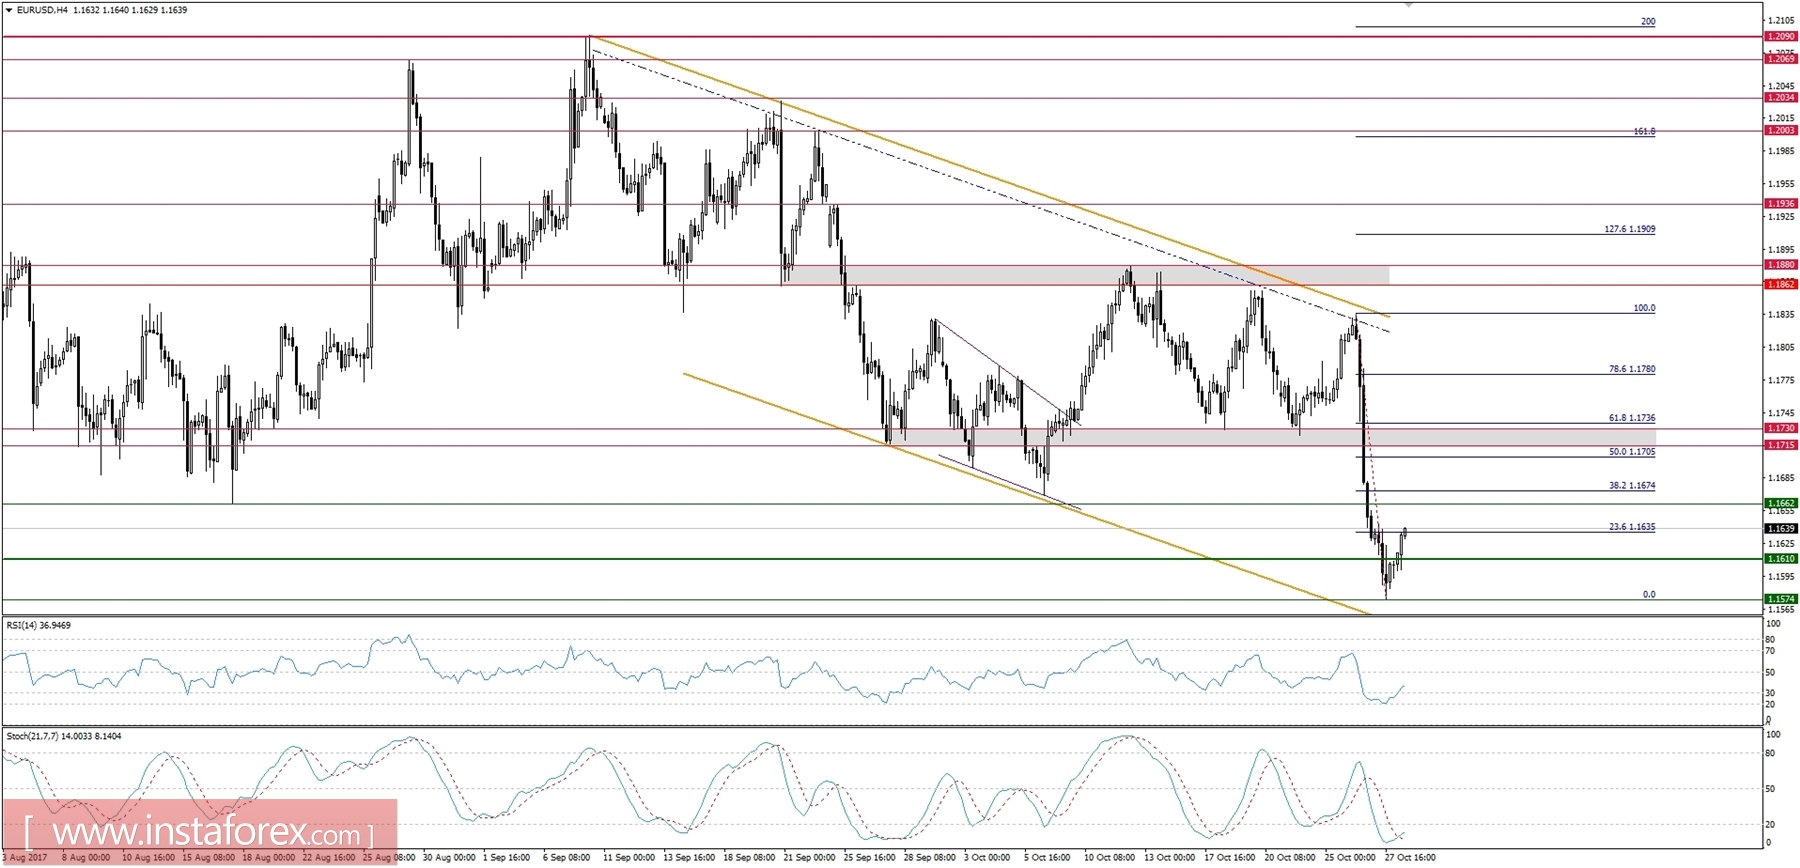
Let's now take a look at the EUR/USD technical picture at the H4 time frame. The weekly support at the level of 1.1610 was violated, but there is no clear down move continuation so far. The nearest technical resistance is at the level of 1.1662, just below the 38% Fibo at the level of 1.1674. The market conditions look oversold, but there is no divergence yet.
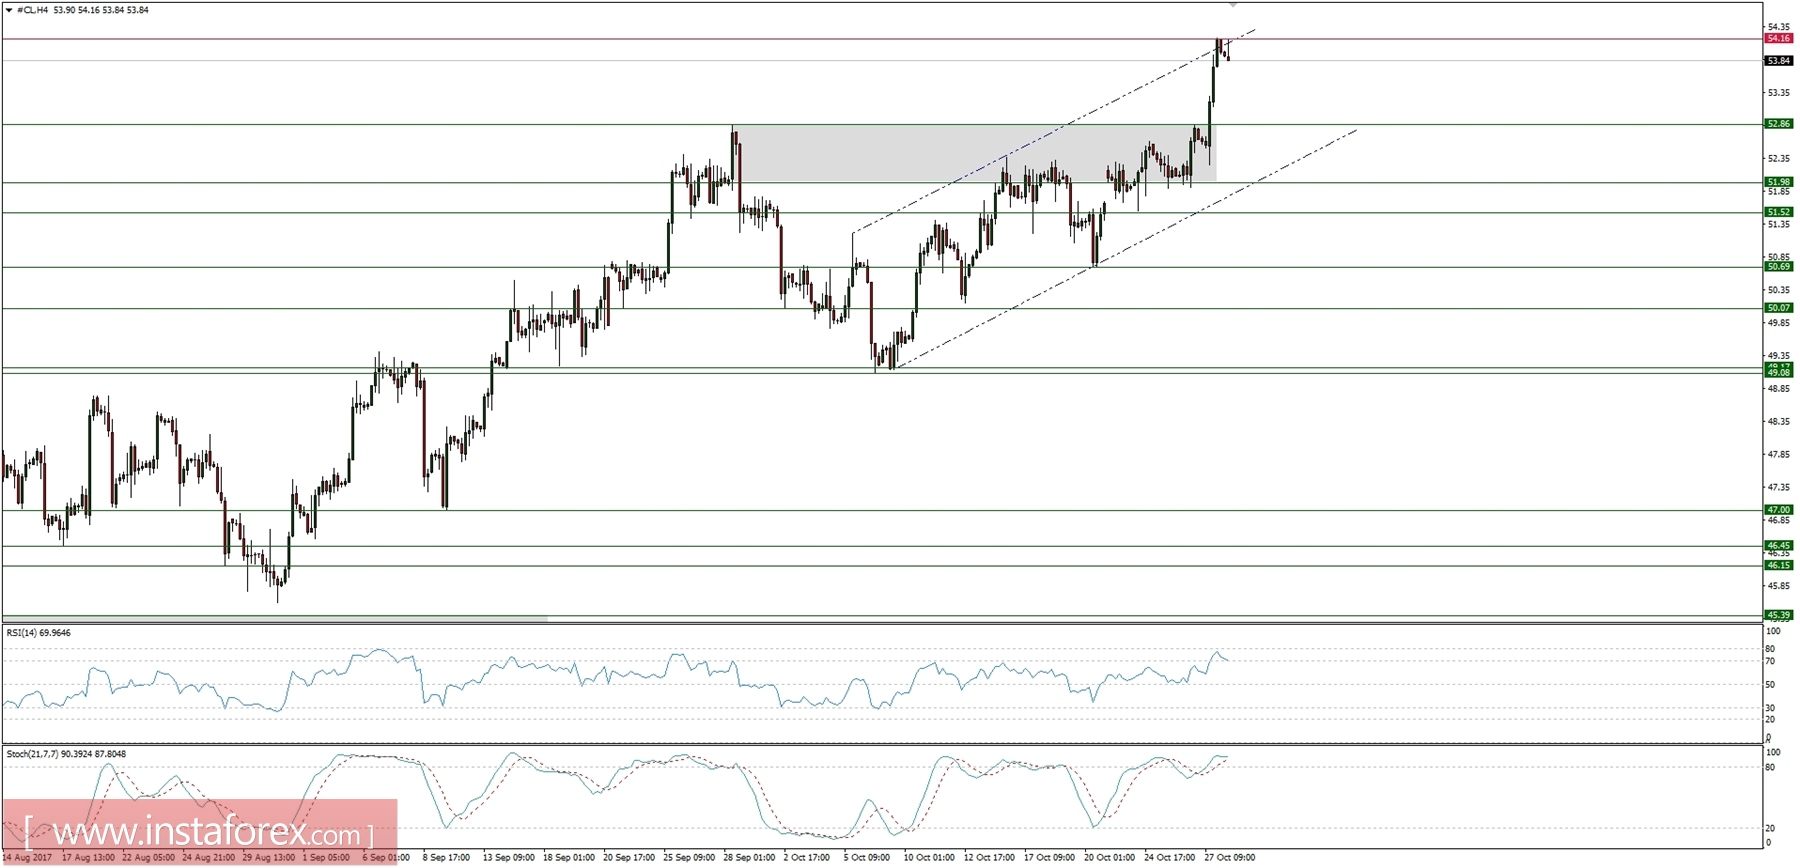
Market Snapshot: Crude Oil breakout
The price of Crude Oil has broken above the technical resistance at the level of $52.86 (now support) and now is trading around the level of $54.16. The next important technical resistance is seen at the level of $54.96. Due to the overbought trading conditions, the technical support at the level of $52.86 should be tested from above before new higher high will be made.
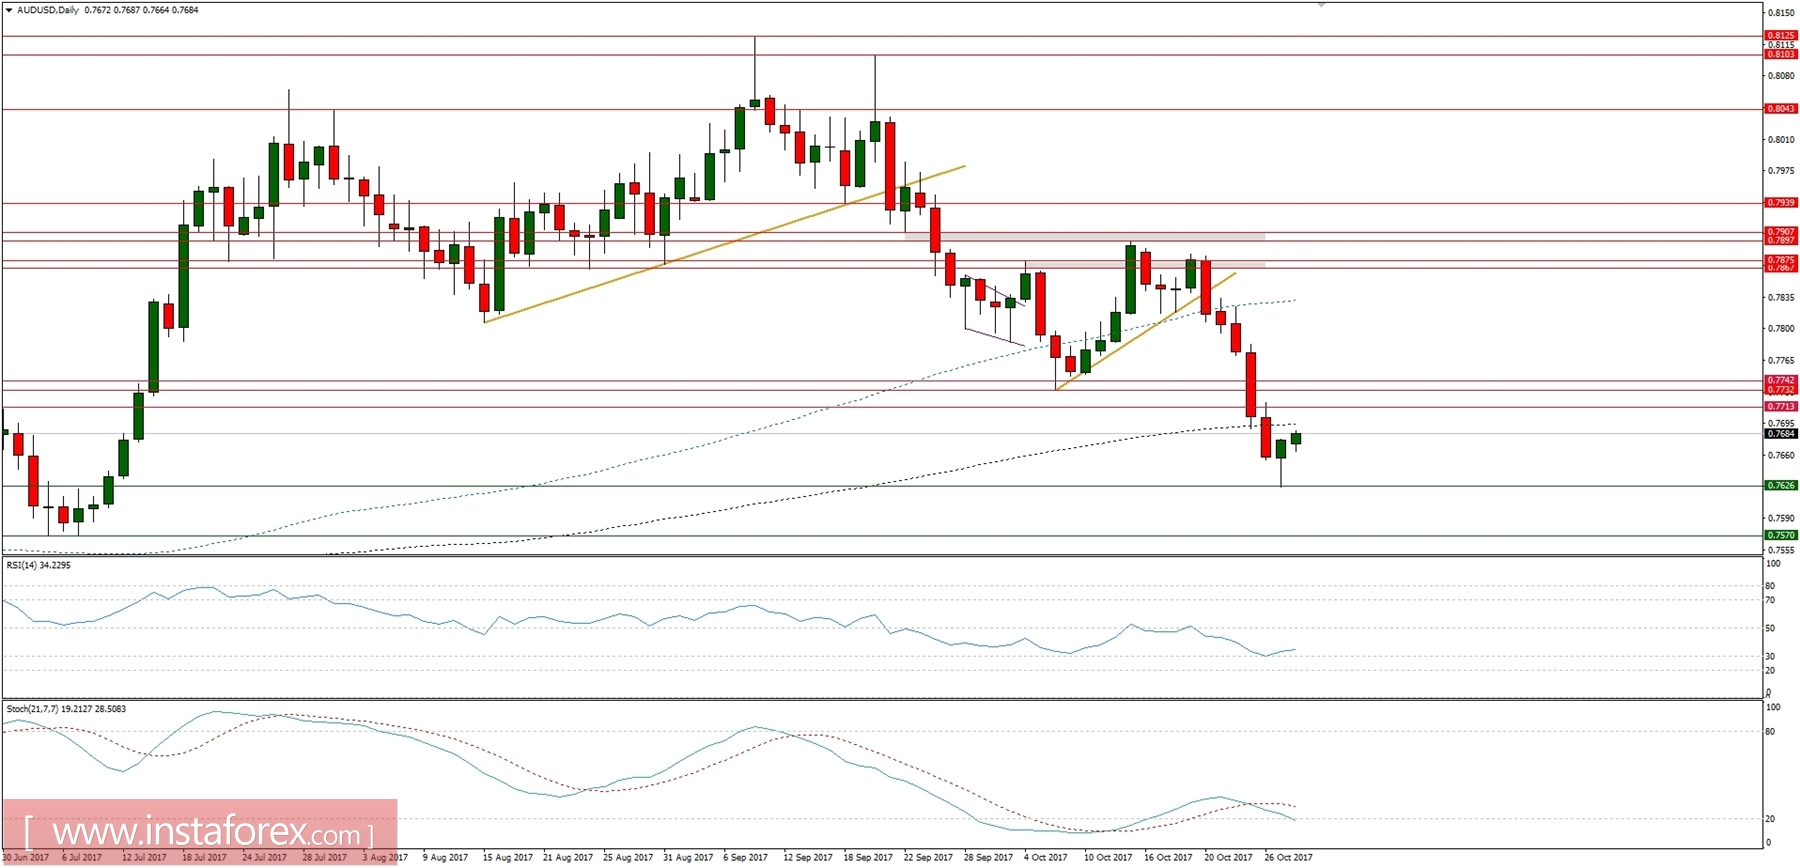
Market Snapshot: AUD/USD makes bullish hammer
The price of AUD/USD has made a bullish hammer candlestick pattern with a low at the level of 0.7626 and now is bouncing up towards the level of 0.7713, the nearest technical resistance. It will be hard to break above the technical resistance zone between the levels of 0.7713 - 0.7742 and the market could reverse in this area.