The Dollar index as expected has pulled back after the strong breakout to new highs last week. Short-term trend remains bullish as long as the price is above 93.50.
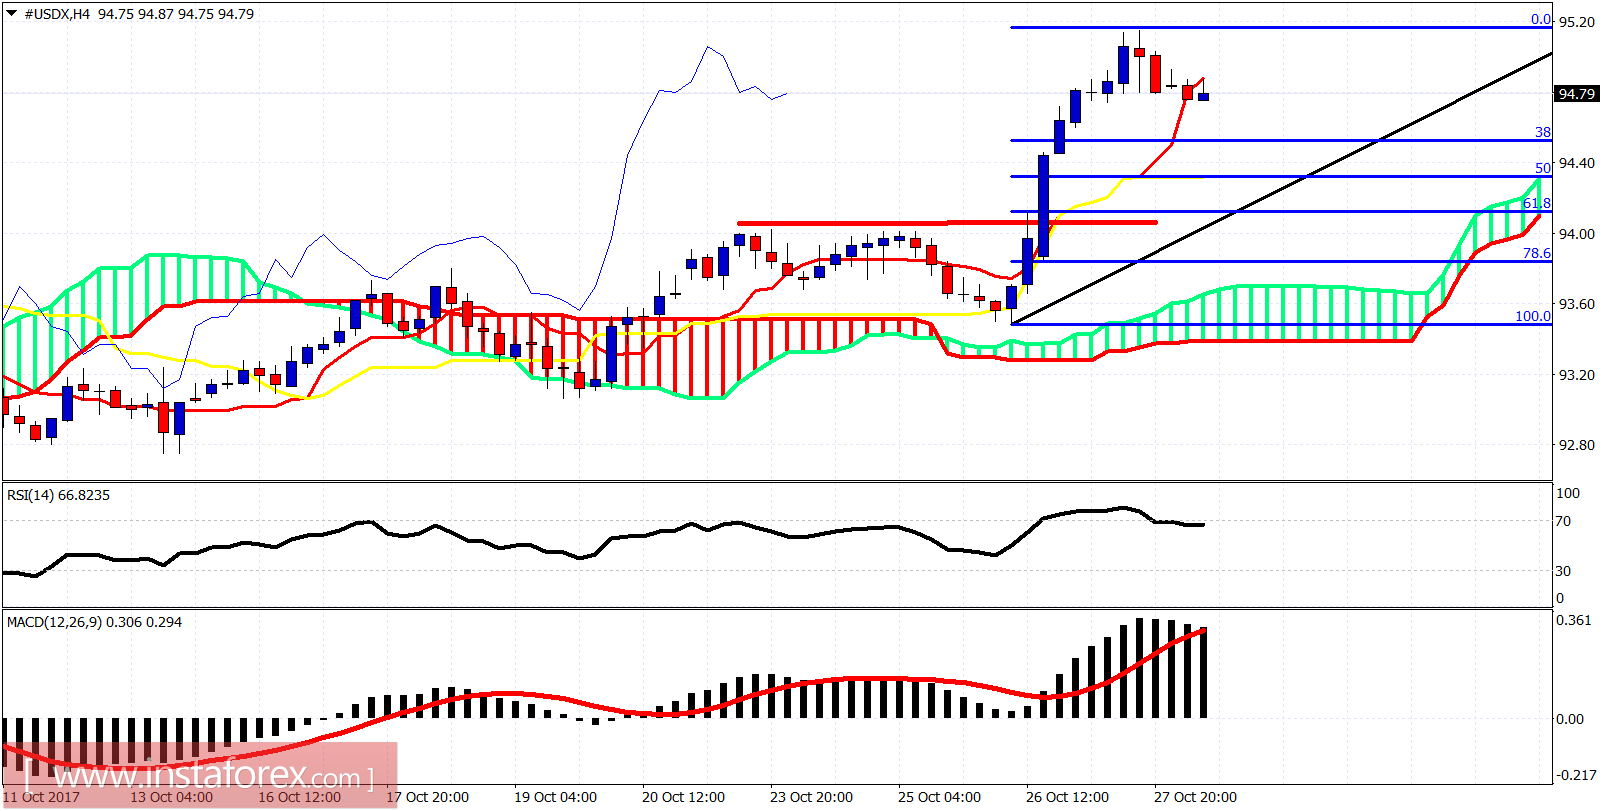
Red line - resistance (broken) now support
The Dollar index is trading above the 4-hour Kumo (cloud) support. Price has not even pulled back towards the 38% Fibonacci retracement of the latest rise. This confirms the strength of the uptrend. Short-term support is at 94.50 and next at 94.10 the previously broken resistance.
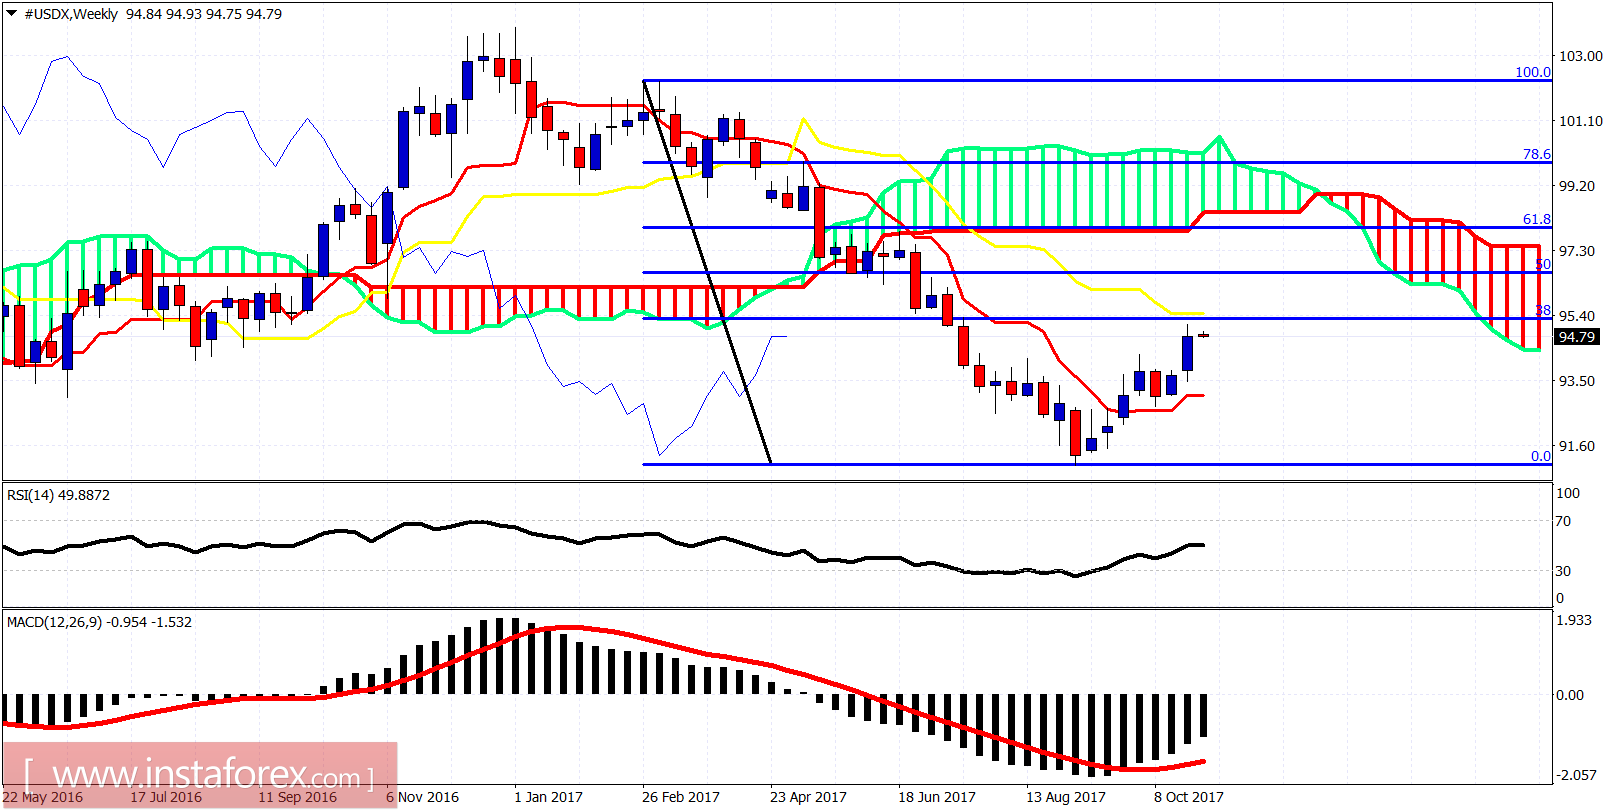
On a weekly basis, the trend remains bearish as the price is below the weekly Kumo (cloud). The kijun-sen (yellow line indicator) resistance is at the same level with the weekly 38% Fibonacci retracement at 95.40. I expect this level to be tested and price to get rejected in order to resume the longer-term downward trend towards 88-90.
*The market analysis posted here is meant to increase your awareness, but not to give instructions to make a trade
 English
  Русский
 Bahasa Indonesia
 Bahasa Malay
 ไทย
ไทย Español
 Deutsch
 Български
 Français
 Tiếng Việt
 中文
中文 বাংলা
বাংলা हिन्दी
 Čeština
 Українська
 Română
