 English
  Русский
 Bahasa Indonesia
 Bahasa Malay
 ไทย
ไทย Español
 Deutsch
 Български
 Français
 Tiếng Việt
 中文
中文 বাংলা
বাংলা हिन्दी
 Čeština
 Українська
 Română

The Gold price remains in a bearish trend at least in the short-term. Price continues to make lower lows and lower highs below the Kumo (cloud). A move towards $1,260-50 is not out of the question as long as we trade below $1,283.
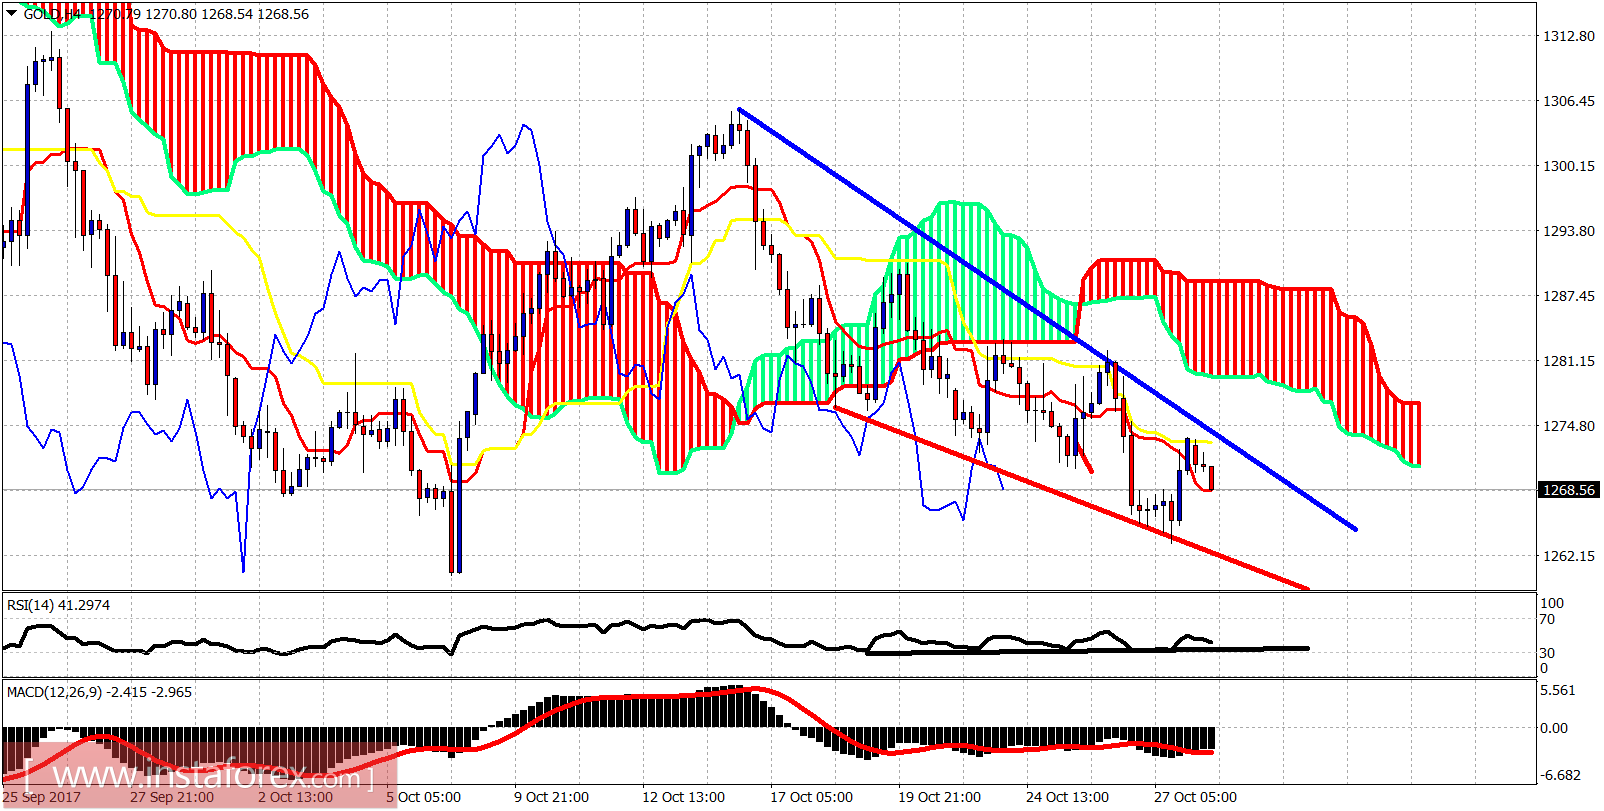
Blue line - resistance
Red line - support
The Gold price is trading below both the tenkan- and kijun-sen indicators inside a downward sloping wedge pattern. Resistance is at $1,275 and next and more important at $1,283. At $1,290 we have the resistance that if broken we have a confirmation of short-term trend change to bullish. Until then the trend is bearish.
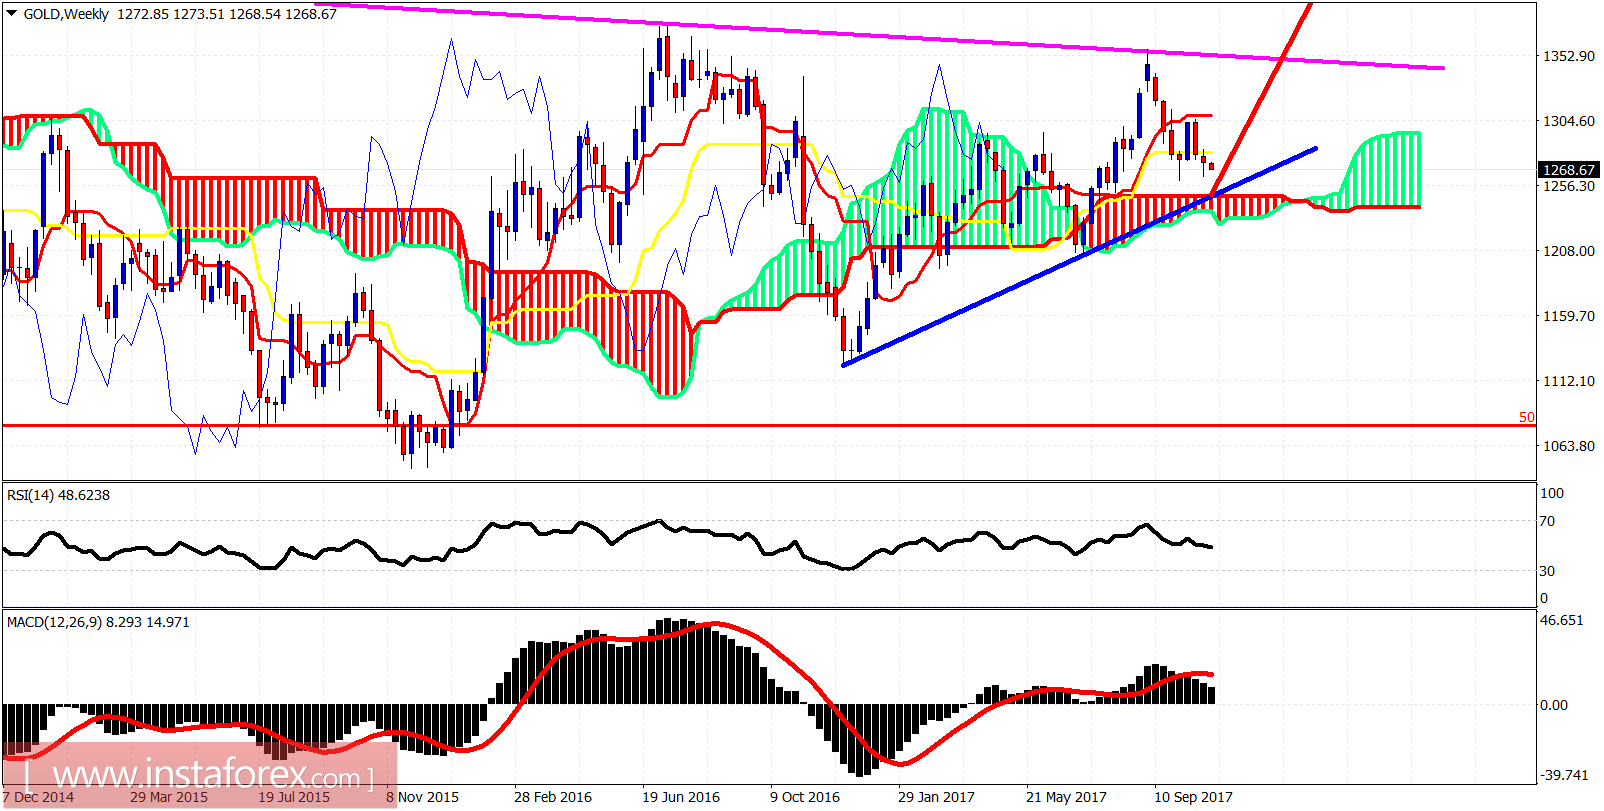
Blue line - long-term support
Magenta line - long-term resistance
Red line - expectation
Gold price is heading towards the weekly Kumo (cloud) and the blue trend line support. There are a lot of chances we go towards that area of support before resuming the uptrend. This scenario is valid as long as we trade below $1,283. If $1,283 is broken upwards then we could say that the decline is most probably over. Only above $1,315, we can be sure that we will not see a lower low.