 English
  Русский
 Bahasa Indonesia
 Bahasa Malay
 ไทย
ไทย Español
 Deutsch
 Български
 Français
 Tiếng Việt
 中文
中文 বাংলা
বাংলা हिन्दी
 Čeština
 Українська
 Română

The index is forming a higher high pattern below the resistance zone of 95.14 and looks forward to reaching new highs in the short-term. If a breakout happens over there, we can expect a rally towards the 95.85 level. To the downside, nearest support lies at 94.60 and if USDX retraces below it, then we should expect a testing of the 200 SMA at H1 chart.
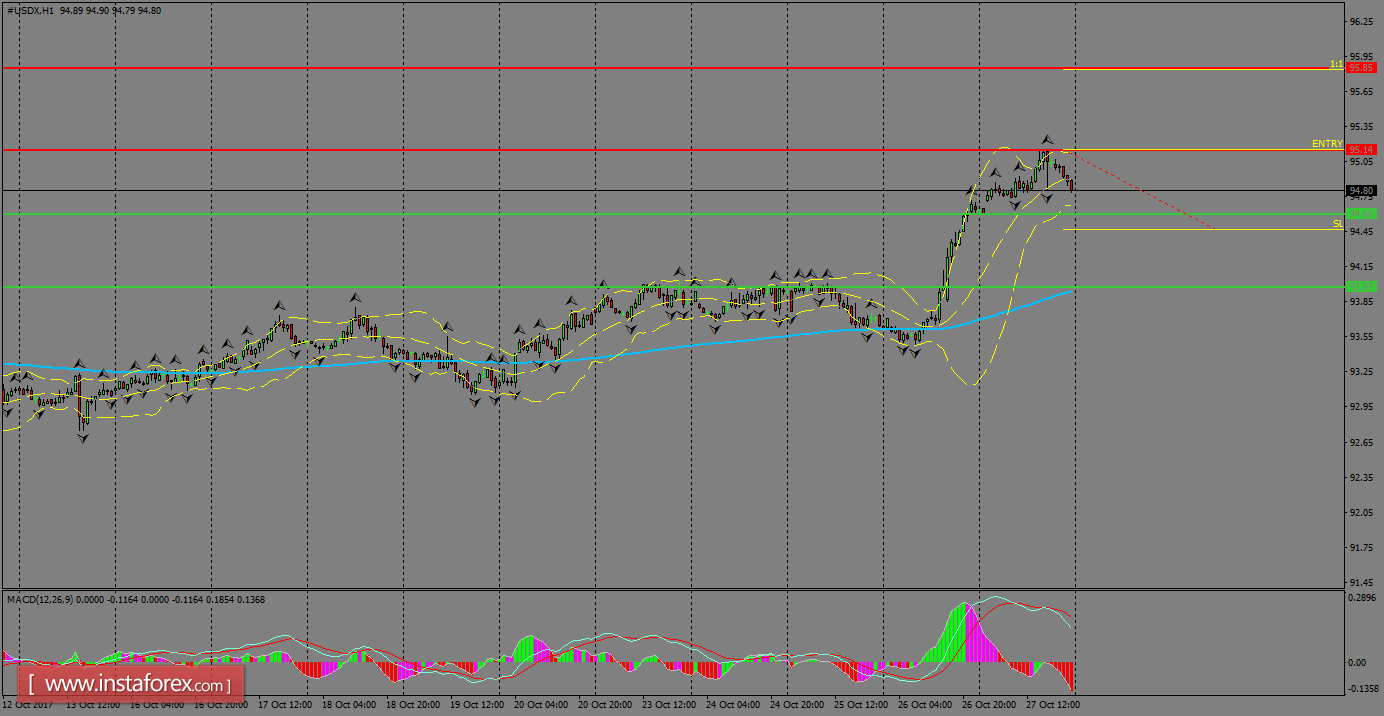
H1 chart's resistance levels: 95.14 / 95.85
H1 chart's support levels: 94.60 / 93.97
Trading recommendations for today: Based on the H1 chart, place buy (long) orders only if the USD Index breaks with a bullish candlestick; the resistance level is at 95.14, take profit is at 95.85 and stop loss is at 94.47.