 English
  Русский
 Bahasa Indonesia
 Bahasa Malay
 ไทย
ไทย Español
 Deutsch
 Български
 Français
 Tiếng Việt
 中文
中文 বাংলা
বাংলা हिन्दी
 Čeština
 Українська
 Română

The pair has resumed the bearish path below the 200 SMA and it's currently forming a lower low pattern that could help to boost the bears in the short-term. With a break below the 1.3037 level, we can expect further declines toward the 1.2870 level, which should strengthen the bearish bias across the board. MACD indicator remains in the positive territory, favoring to a recovery.
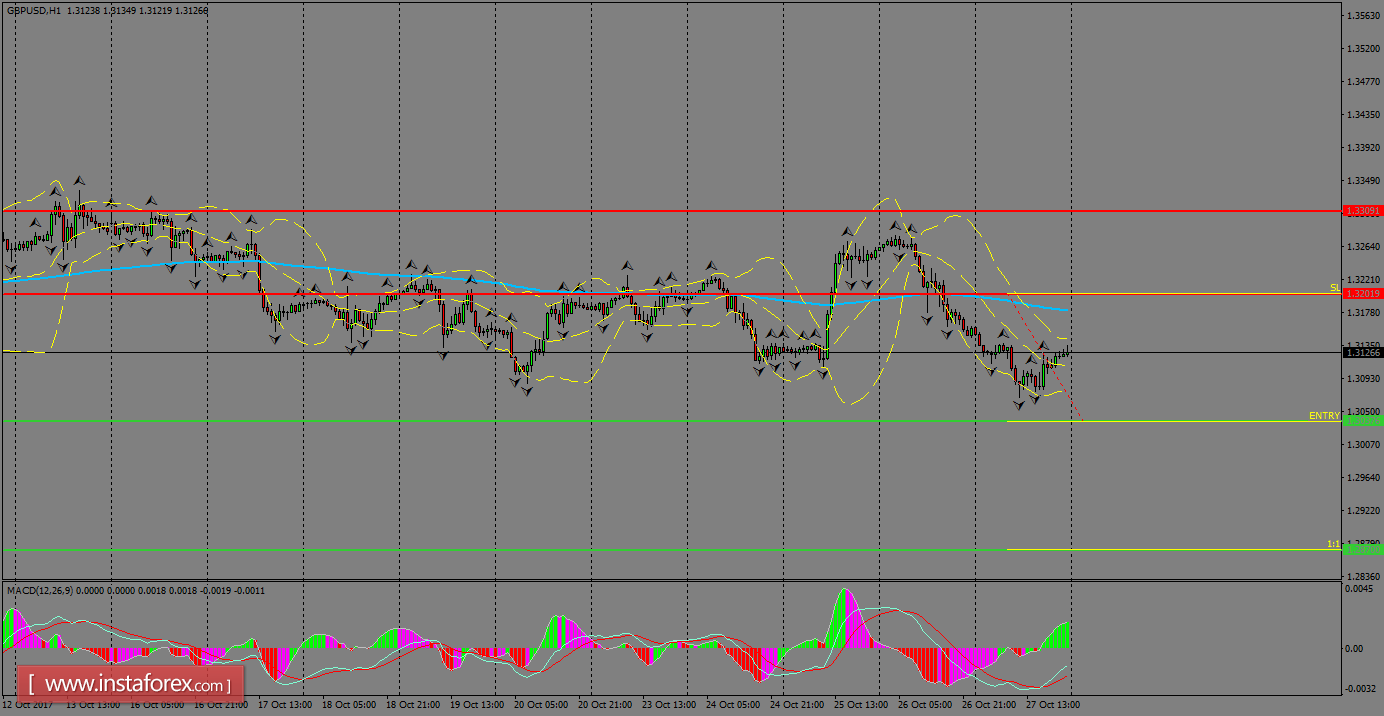
H1 chart's resistance levels: 1.3201 / 1.3309
H1 chart's support levels: 1.3037 / 1.2870
Trading recommendations for today: Based on the H1 chart, sell (short) orders only if the GBP/USD pair breaks a bearish candlestick; the support level is at 1.3037, take profit is at 1.2870 and stop loss is at 1.3201.