English
  Русский
 Bahasa Indonesia
 Bahasa Malay
 ไทย
ไทย Español
 Deutsch
 Български
 Français
 Tiếng Việt
 中文
中文 বাংলা
বাংলা हिन्दी
 Čeština
 Українська
 Română

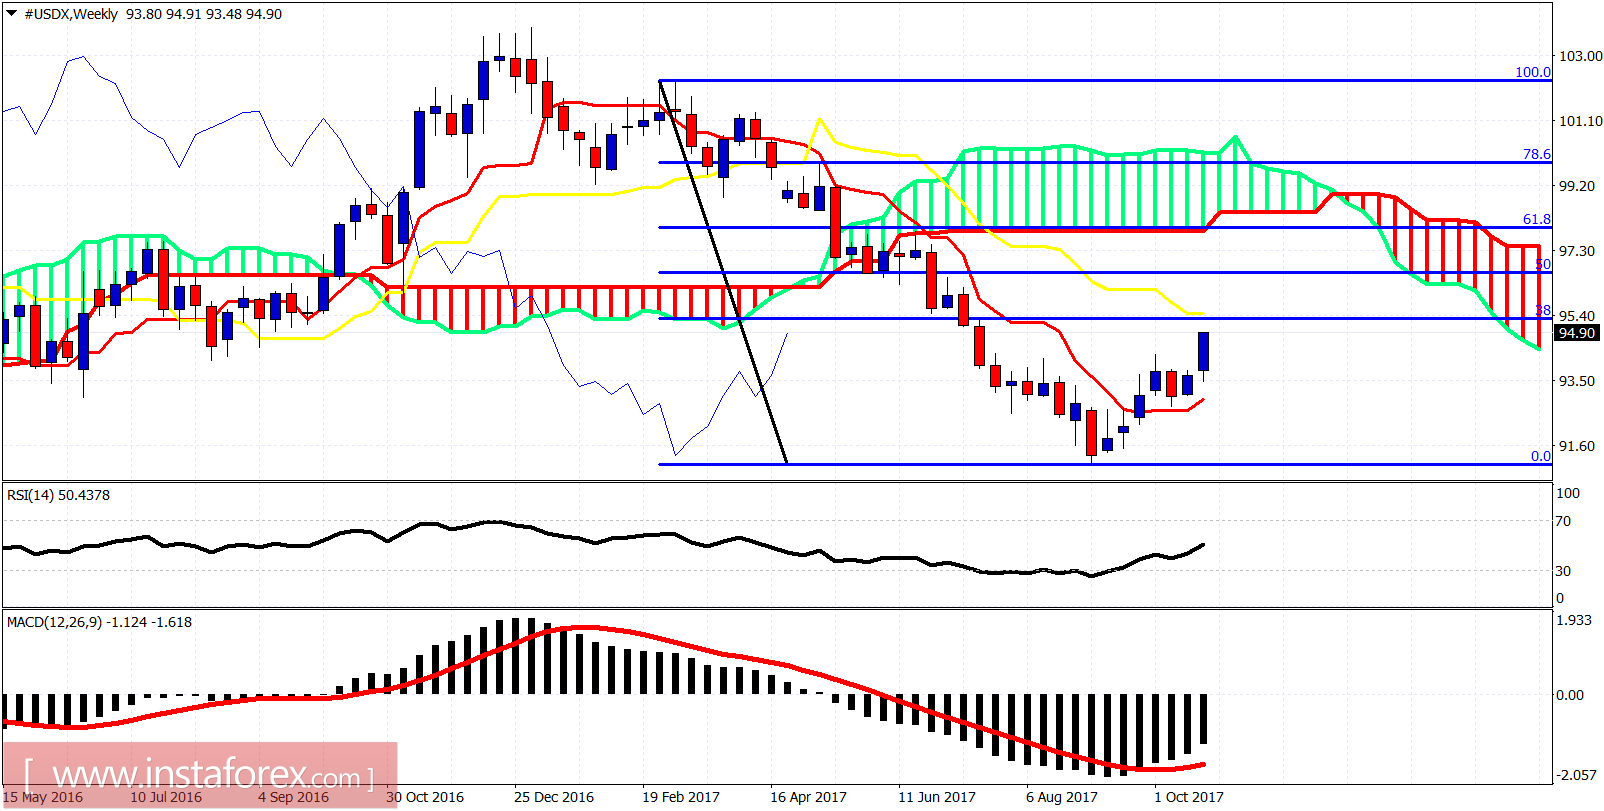
The Dollar index is breaking to new higher highs as it remains in a bullish short-term trend. We might see a pullback but I give little chances that the upward move from 93.50 will end soon.
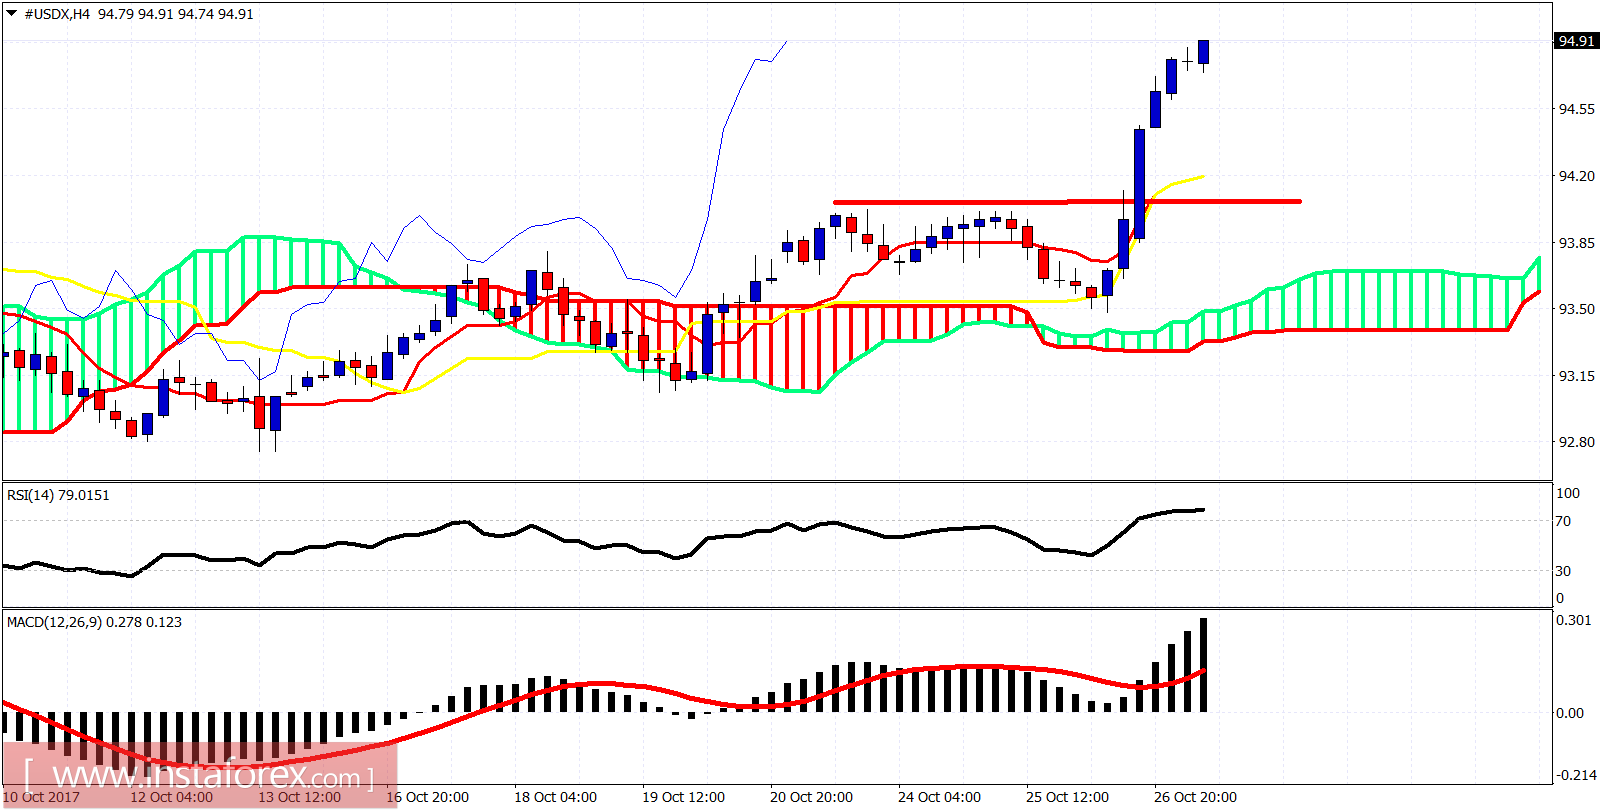
Red line - resistance
As we said yesterday, a break above recent double top at 94, would be a bullish sign and the index would first move towards 94.50 and next towards 95. The first target has been achieved. We also said yesterday that as long as the price is above 93.50 trend remains bullish in the short-term. Short-term support can also be found now at 94.10-94 area where the previously had our important resistance level.