English
  Русский
 Bahasa Indonesia
 Bahasa Malay
 ไทย
ไทย Español
 Deutsch
 Български
 Français
 Tiếng Việt
 中文
中文 বাংলা
বাংলা हिन्दी
 Čeština
 Українська
 Română

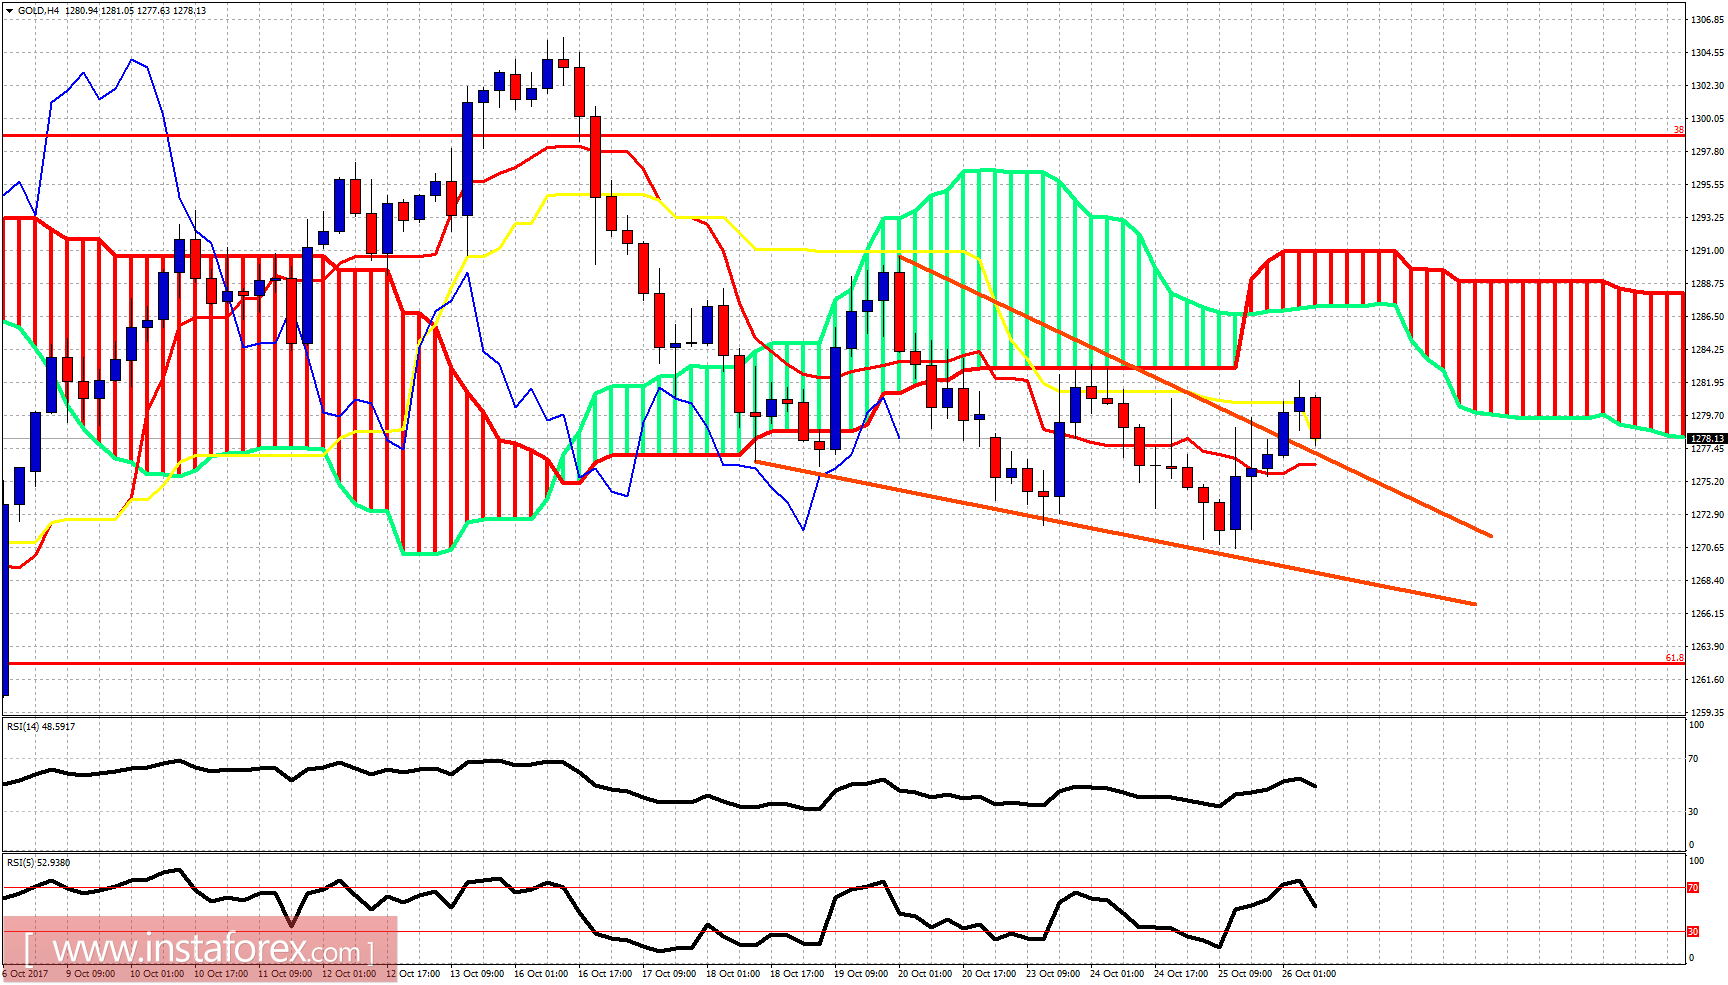
Gold is bouncing as expected. However, the price remains below the 4hour Kumo (cloud) while testing the first important short-term resistance by the kijun-sen at $1,283. The short-term trend remains bearish but we have several indications that the low could already be in.
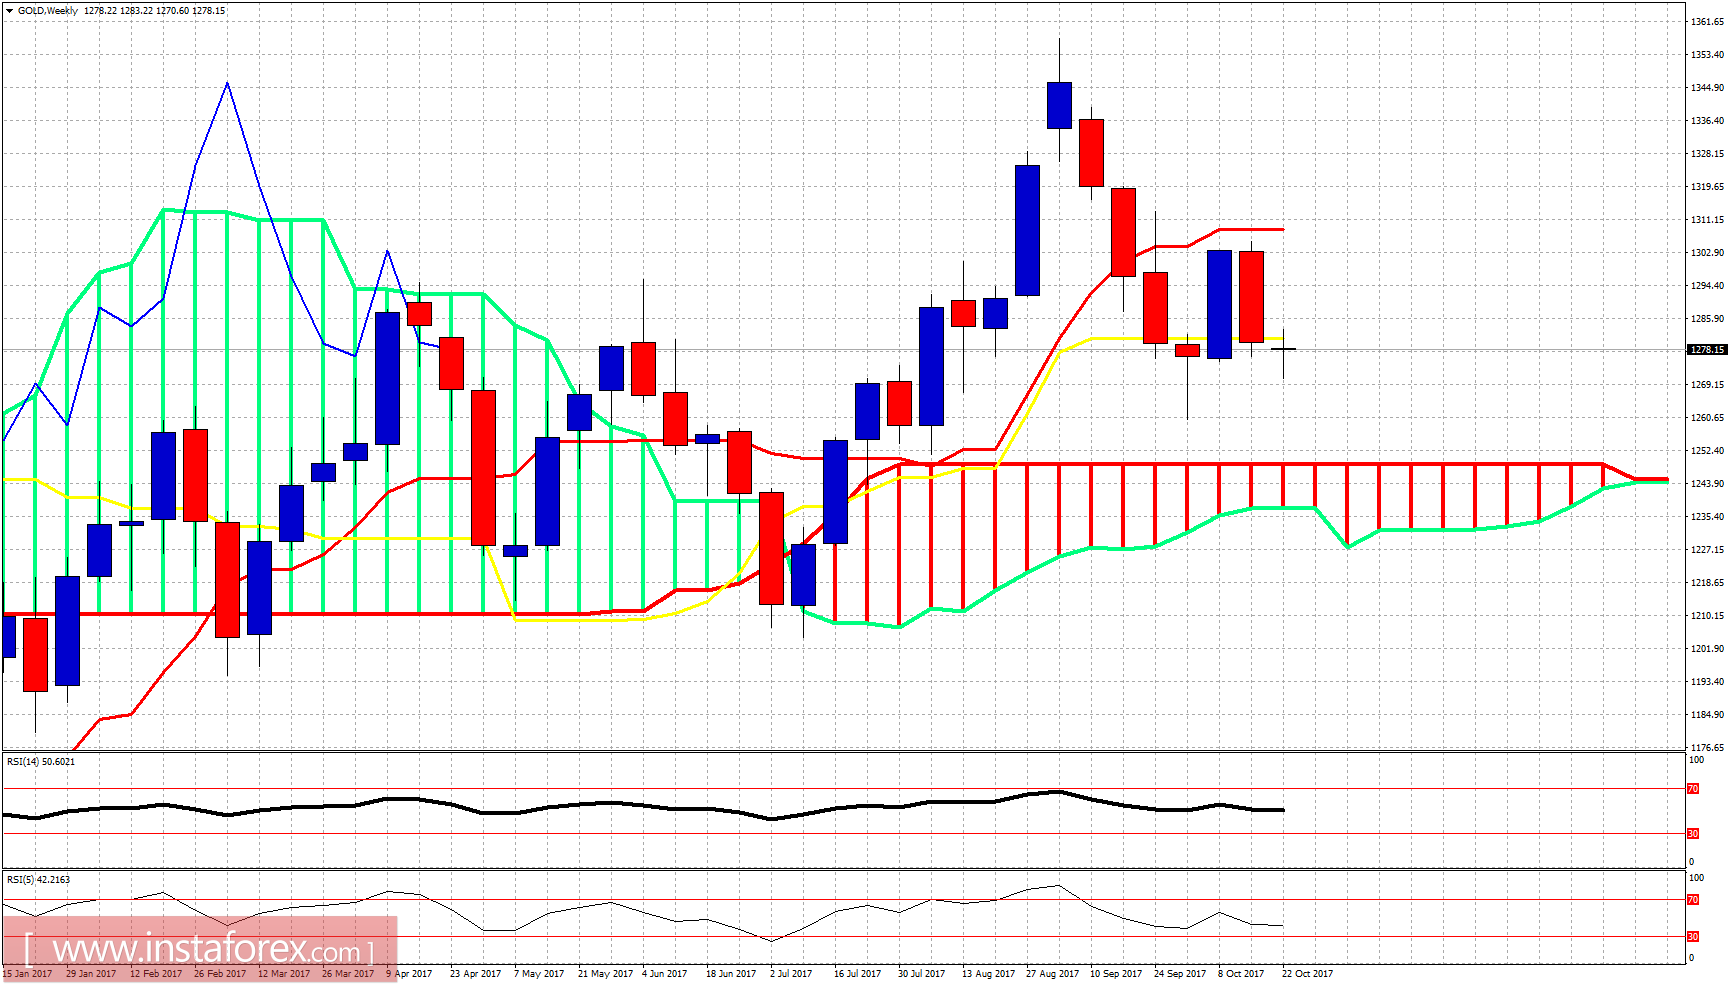
Gold price has broken out of the Wedge pattern as expected. The precious metal is now back testing the broken upper Wedge boundary. Resistance is at $1,283 and the next one lies at $1,290. Gold bulls will need to break these levels in order to have a chance to test the important medium-term resistance area at $1,307-15. Support is at $1,270 and the next one is at $1,250.