 English
  Русский
 Bahasa Indonesia
 Bahasa Malay
 ไทย
ไทย Español
 Deutsch
 Български
 Français
 Tiếng Việt
 中文
中文 বাংলা
বাংলা हिन्दी
 Čeština
 Українська
 Română

The index made a retracement below the critical resistance level of 94.04 and now, it's testing the 200 SMA at H1 chart. The outlook for the US Dollar remains bullish despite recent moves, but if the moving average gives up, we can expect a testing of the support level of 93.00. MACD indicator is favoring to the bears so far.
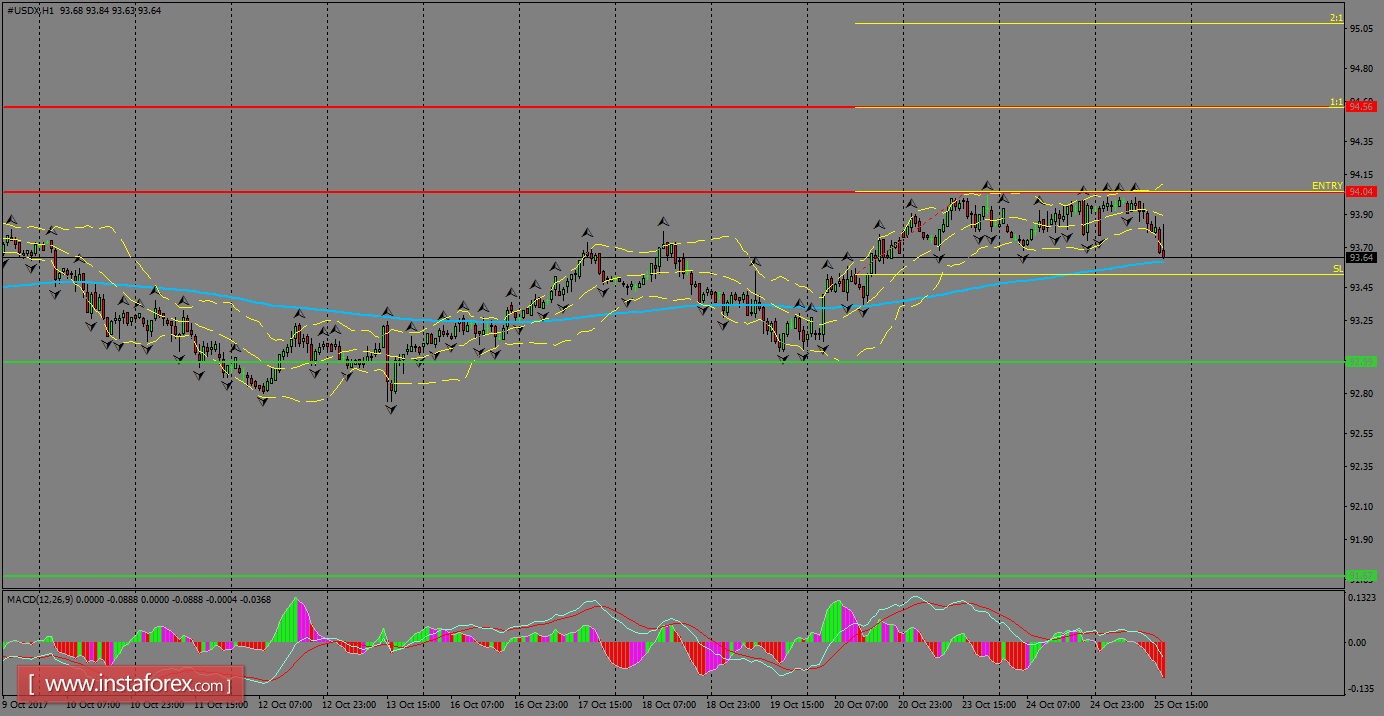
H1 chart's resistance levels: 94.04 / 94.56
H1 chart's support levels: 93.00 / 91.67
Trading recommendations for today: Based on the H1 chart, place buy (long) orders only if the USD Index breaks with a bullish candlestick; the resistance level is at 94.04, take profit is at 94.56 and stop loss is at 93.52.