 English
  Русский
 Bahasa Indonesia
 Bahasa Malay
 ไทย
ไทย Español
 Deutsch
 Български
 Français
 Tiếng Việt
 中文
中文 বাংলা
বাংলা हिन्दी
 Čeština
 Українська
 Română

The pair has made a strong rally above the 200 SMA and it's an indication that it can remain trapped in a narrow range across the board. The resistance zone of 1.3309 should be the top of the mentioned range and if it manages to break above that area, next target should be at 1.3373. To the downside, the moving average at H1 chart should act as dynamic support.
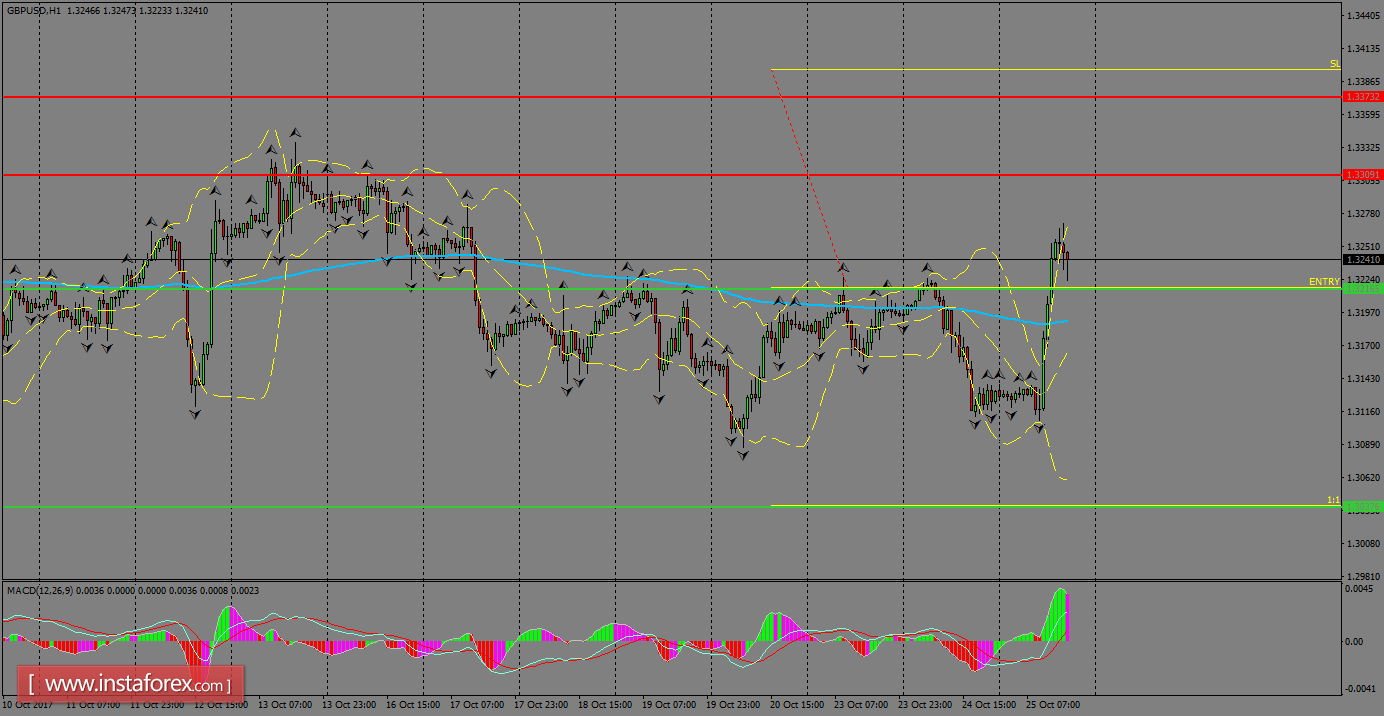
H1 chart's resistance levels: 1.3309 / 1.3373
H1 chart's support levels: 1.3216 / 1.3037
Trading recommendations for today: Based on the H1 chart, sell (short) orders only if the GBP/USD pair breaks a bearish candlestick; the support level is at 1.3216, take profit is at 1.3037 and stop loss is at 1.3398.