English
  Русский
 Bahasa Indonesia
 Bahasa Malay
 ไทย
ไทย Español
 Deutsch
 Български
 Français
 Tiếng Việt
 中文
中文 বাংলা
বাংলা हिन्दी
 Čeština
 Українська
 Română

The Dollar index is back near its highs just below 94 but with RSI diverging, I believe we will not break convincingly above 94. I expect at least a short-term pull back towards 93.50 at least. The trend remains bullish.
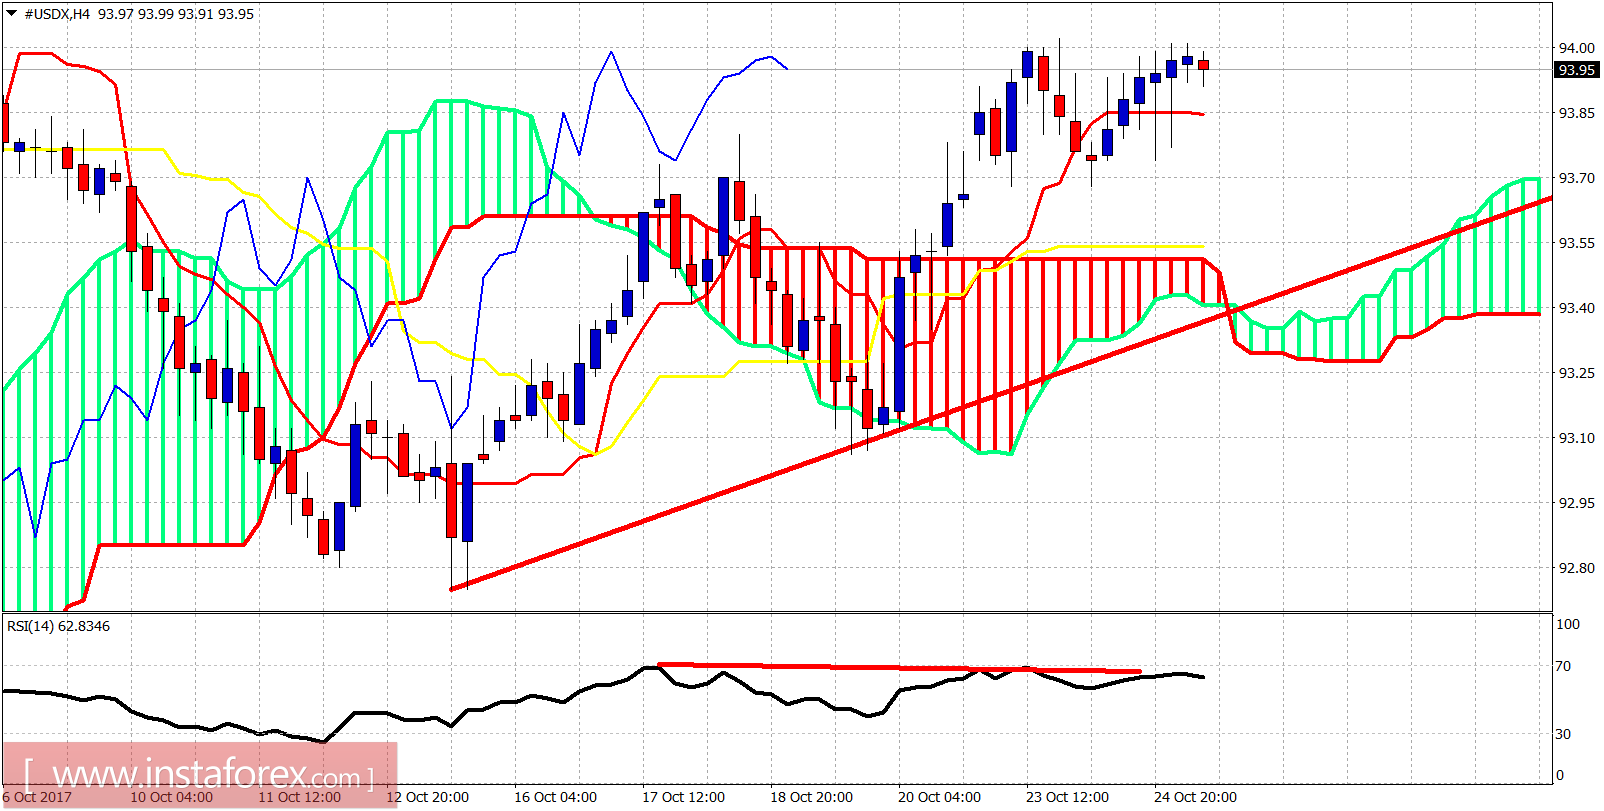
Red trend line -support
The Dollar index is making higher highs and higher lows. Short-term trend is bullish as the price is above the Kumo (cloud) in the 4-hour chart. Support is at 93.55 and next at 93.40. Resistance is at 94.